Guide to Iceland reviewed official population statistics to examine who lives in Iceland and how its population has changed. The study combines published figures with our own calculations to explore population growth, immigration, age, settlement patterns, and religious registration.
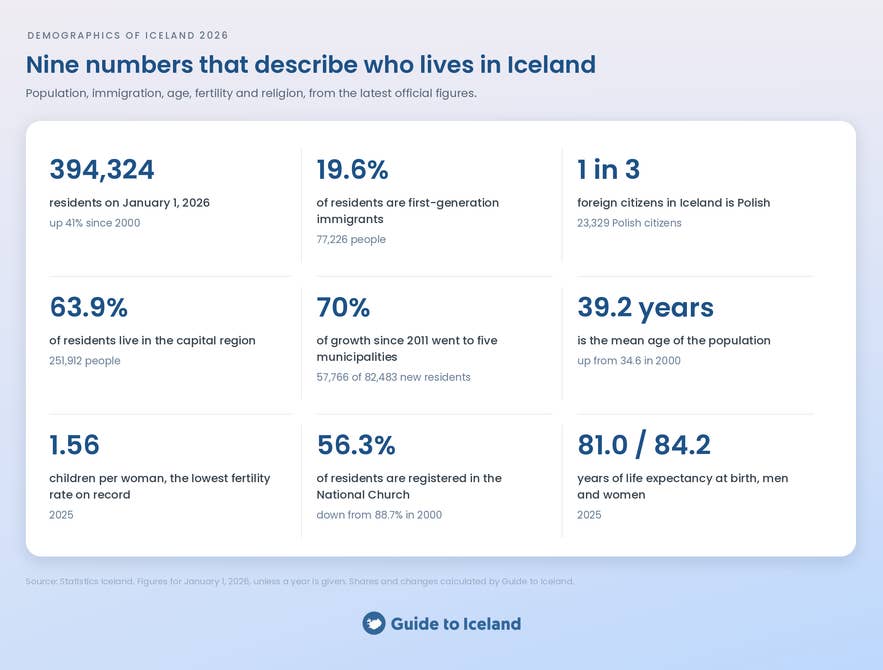
Iceland had 394,324 residents on January 1, 2026, with first-generation immigrants accounting for roughly one in five. Nearly two in three residents lived in the capital region, while the population's mean age had reached 39.2 years.
Our analysis found that five municipalities accounted for 70.0% of Iceland's net population growth between 2011 and 2026. Reykjavik added the most residents, while Myrdalshreppur, the municipality containing Vik, had the highest percentage growth.
The sections below explore where people live, where newcomers come from, and how births, migration, and aging are changing the population. They also connect these figures with Icelandic people and culture and where Icelanders came from.
Religion adds another perspective on the population, with Iceland's churches reflecting its Christian history. The study examines registered religious membership alongside belief surveys, which measure different aspects of religious life.
Cite This Study
The charts and data in this study are free to use under CC BY 4.0. Credit Guide to Iceland and link to this page. Every chart has an Embed button underneath it with ready-to-paste code.
Iceland in Numbers
| Indicator | Value | Reference date or period |
|---|---|---|
| Population | 394,324 | Jan 1, 2026 |
| Population growth in 2025 | +4,880 (+1.25%) | 2025 |
| Foreign citizens | 70,555 (17.9%) | Jan 1, 2026 |
| First-generation immigrants | 77,226 (19.6%) | Jan 1, 2026 |
| First- and second-generation immigrants | 85,577 (21.7%) | Jan 1, 2026 |
| Largest foreign citizenship group | Polish, 23,329 | Jan 1, 2026 |
| Residents in the capital region | 251,912 (63.9%) | Jan 1, 2026 |
| Mean age | 39.2 years | Jan 1, 2026 |
| Total fertility rate | 1.56 children per woman | 2025 |
| Life expectancy at birth | Males: 81.0 years. Females: 84.2 years | 2025 |
| Residents registered in the National Church | 56.3% | Jan 1, 2026 |
Source: Statistics Iceland. Combined counts, population growth, and shares calculated by Guide to Iceland where applicable.
How Has Iceland's Population Changed?
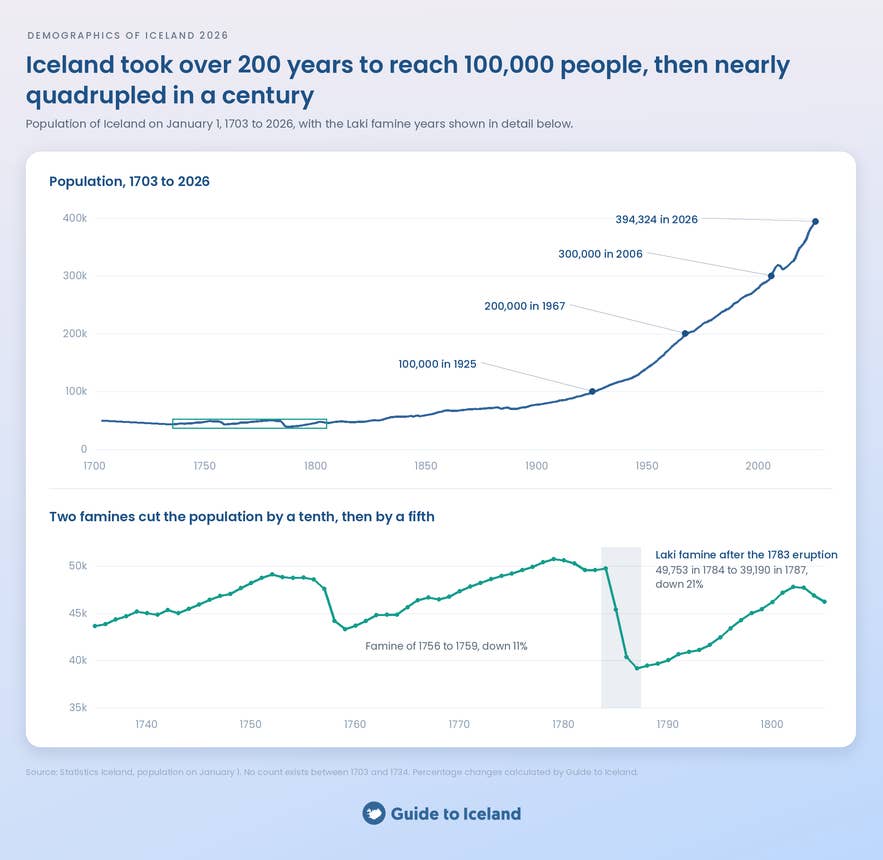
Our calculations using Statistics Iceland's population figures show that Iceland's population grew 41% between 2000 and 2026, from 279,049 to 394,324. For centuries, however, population growth was slow and repeatedly interrupted by epidemics and food shortages.
Statistics Iceland's historical series records 50,358 people in the first full census, taken in 1703. A smallpox epidemic beginning in 1707 and the famine following the Laki eruption of 1783–1784 kept the population below that level for much of the following century. It passed the 1703 count permanently in 1829.
Laki was among the most devastating events in Iceland's long history of eruptions. Volcanic pollution, fluorine poisoning, and shortages of fodder caused enormous livestock losses, commonly estimated at about 80% of sheep, half of cattle, and three-quarters of horses.
The population fell from 49,753 in 1784 to 39,190 in 1787, a loss of 21%. Hunger, disease, and fewer births all contributed to the decline. A 2024 study by Claudia Elisabeth Wieners and Guðmundur Hálfdanarson found that hunger and disease best explained the patterns of excess mortality after the eruption.
Sustained population growth began in the nineteenth century and accelerated during the twentieth, alongside urbanization, the development of a motorized fishing fleet, and falling infant mortality. Iceland reached 100,000 people in 1925, 200,000 in 1967, and 300,000 in 2006. Our history of Iceland explains the country's wider transformation.
What Drives Iceland's Population Growth?
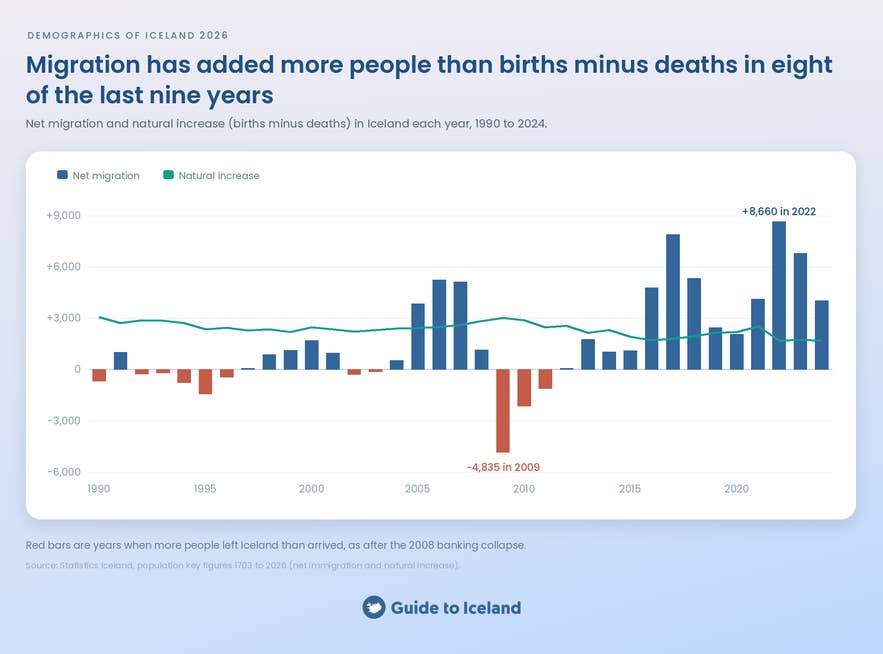
Statistics Iceland's figures show that net migration now contributes more to Iceland's population growth than natural increase, meaning births minus deaths. Natural increase averaged about 2,600 people a year during the 1990s. In 2024, it added about 1,700 people. Annual net migration ranged from about 2,000 to 8,700 between 2016 and 2024.
The table compares the peak migration year, the recent period of growth, and the years after the banking collapse.
| Calendar year or period | Total population change | Net migration | Natural increase | Statistical adjustments |
|---|---|---|---|---|
| 2022 | +10,301 | +8,660 | +1,693 | −52 |
| 2016–2024, total | +63,408 | +46,195 | +17,552 | −339 |
| 2009–2011, total | −6,186 | −8,083 | +8,401 | −6,504 |
Source: Statistics Iceland population-development data. Period totals and statistical-adjustment differences calculated by Guide to Iceland.
Total population change includes statistical adjustments, so it does not always equal net migration plus natural increase. The adjustment column shows the difference.
After the 2008 banking collapse, around 8,000 more people left Iceland than arrived during 2009–2011. Births still exceeded deaths during those years.
The revised population series also includes a large adjustment for 2010, so the recorded population decline cannot be explained by migration alone. Our study of the economy of Iceland covers the crash and the tourism boom that followed.
In 2024, Statistics Iceland revised its population estimates to better identify people who actually lived in the country. The revision reduced the January 1, 2024 estimate from 398,971 to 383,726, a difference of 15,245. Earlier figures close to 400,000 used the previous counting method.
Where Do People Live in Iceland?
Statistics Iceland's regional population data show that nearly two in three people in Iceland live in the capital region around Reykjavik. Outside that region, an area larger than Portugal holds about 140,000 people.
Reykjanes, home to Keflavik International Airport, has grown strongly since 1998. Selfoss has also expanded rapidly, nearly doubling from 5,702 people in 2006 to 11,000 in 2026.
The Westfjords and Northwest Iceland remain smaller than they were in 1998, although their populations have been more stable in recent years.
What Are Iceland's Largest Towns?
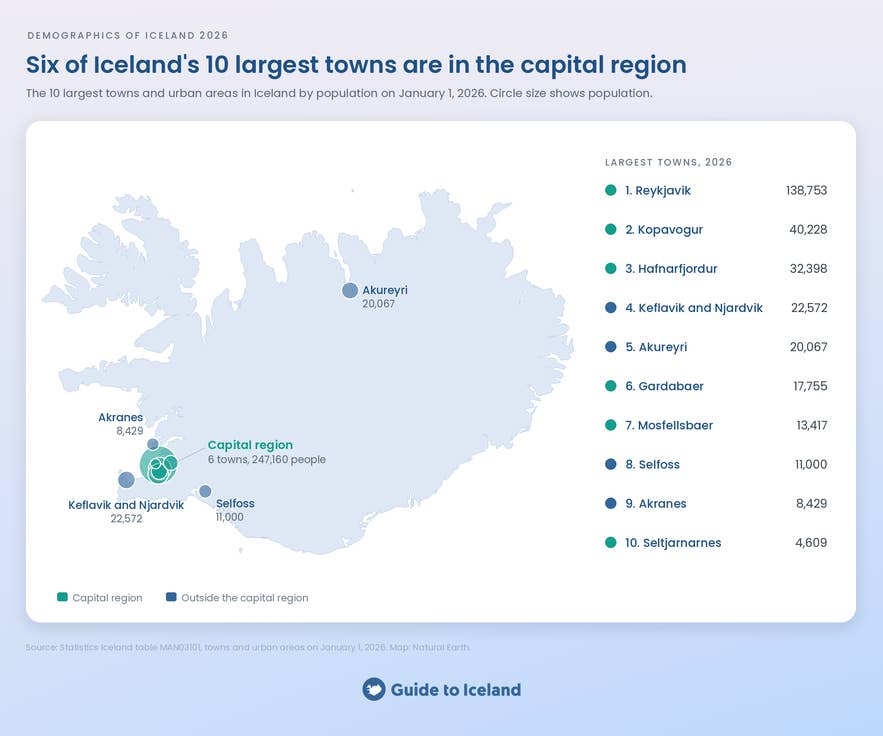
Reykjavik is Iceland's largest urban area, followed by Kopavogur and Hafnarfjordur. The table shows the ten largest urban areas in 2026, using town populations rather than the populations of entire municipalities.
| Town or urban area | Population, Jan 1, 2026 | Population, Jan 1, 2006 |
|---|---|---|
| Reykjavik | 138,753 | 114,042 |
| Kopavogur | 40,228 | 26,495 |
| Hafnarfjordur | 32,398 | 22,496 |
| Keflavik and Njardvik | 22,572 | 11,209 |
| Akureyri | 20,067 | 16,532 |
| Gardabaer | 17,755 | 9,414 |
| Mosfellsbaer | 13,417 | 6,890 |
| Selfoss | 11,000 | 5,702 |
| Akranes | 8,429 | 5,767 |
| Seltjarnarnes | 4,609 | 4,471 |
Source: Statistics Iceland table MAN03101. Historical figures use the counting method and urban boundaries applicable to their period.
Akureyri is the only town outside the capital region, Reykjanes, and Selfoss with more than 10,000 people. Isafjordur and Egilsstadir are the largest towns in the Westfjords and the east, respectively.
Grindavik's recorded urban-area population fell from 3,559 in January 2023 to 817 in January 2026, a decline of 77.0% in our calculations. The first date precedes its November 2023 evacuation during seismic and magma activity before the Sundhnukur eruption sequence.
Statistics Iceland notes that nobody dwelled in Grindavik on January 1, 2024, although the table retains a population count for that date. The figures therefore need to be distinguished from physical occupancy during the evacuation. The municipality population was slightly higher than the urban-area count, at 819 in 2026.
Where Has Iceland's Population Growth Concentrated?
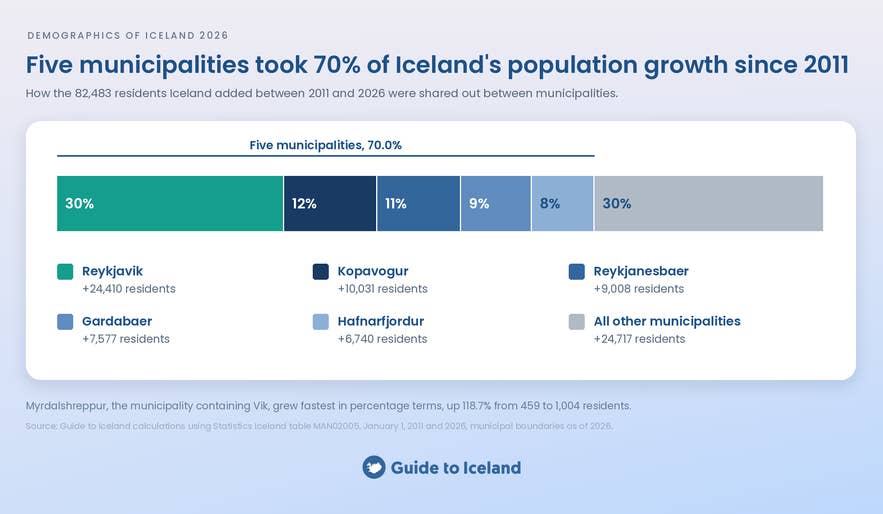
Our analysis of Statistics Iceland's municipality data found that five municipalities accounted for 70.0% of Iceland's net population growth between 2011 and 2026. Together, they added 57,766 residents, compared with 82,483 across the country.
| Municipality | Residents added, 2011–2026 | Population growth | Share of national net growth |
|---|---|---|---|
| Reykjavik | 24,410 | 21.2% | 29.6% |
| Kopavogur | 10,031 | 33.2% | 12.2% |
| Reykjanesbaer | 9,008 | 65.8% | 10.9% |
| Gardabaer | 7,577 | 57.6% | 9.2% |
| Hafnarfjordur | 6,740 | 26.3% | 8.2% |
| Combined | 57,766 | 29.2% | 70.0% |
Source: Guide to Iceland calculations using Statistics Iceland table MAN02005. Figures refer to January 1 and use municipal boundaries as of January 1, 2026. Percentages are rounded.
Reykjavik added the most residents, with an increase of 24,410. Reykjanesbaer grew considerably faster in percentage terms, increasing 65.8%, compared with Reykjavik's 21.2% and the national increase of 26.5%.
Myrdalshreppur, the municipality containing Vik, had the highest percentage growth across all municipalities. Its population rose from 459 to 1,004, an increase of 118.7%. Its gain of 545 residents shows how a smaller population can grow rapidly while contributing a smaller share of national growth.
The same five municipalities accounted for 67.4% of national net growth between 2016 and 2026. Reykjanesbaer ranked second for residents added during this shorter period, ahead of Kopavogur.
Where Do Foreign Citizens Live in Iceland?
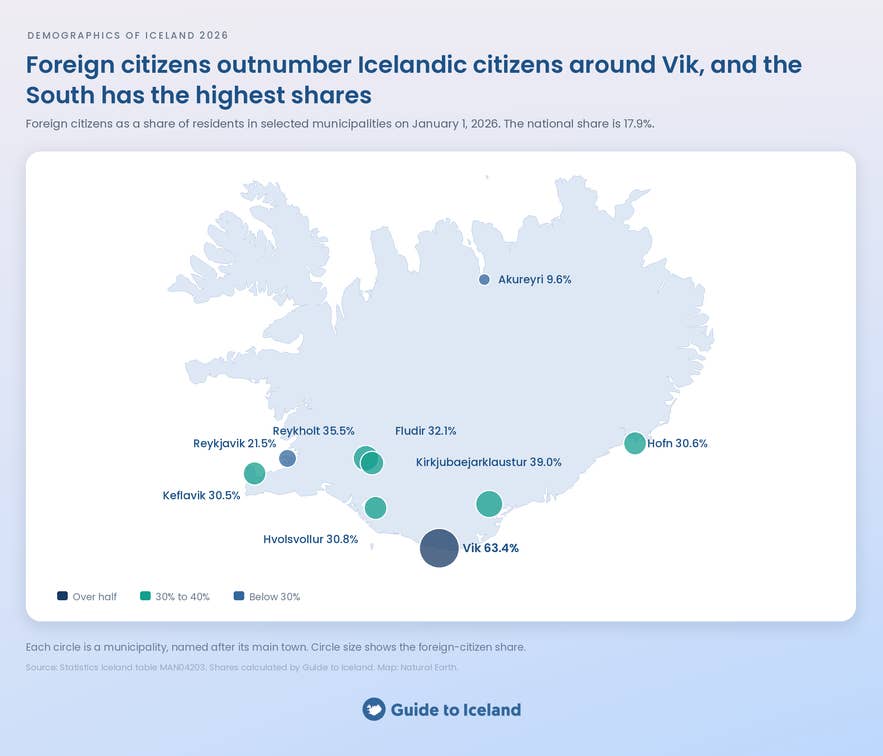
According to Statistics Iceland's citizenship data, foreign citizens made up 17.9% of Iceland's population on January 1, 2026, but their share varied considerably between municipalities. Several municipalities in the south had particularly high shares.
| Municipality | Main town or towns | Foreign citizens / all residents | Share of residents |
|---|---|---|---|
| Myrdalshreppur | Vik | 637 / 1,004 | 63.4% |
| Skaftarhreppur | Kirkjubaejarklaustur | 254 / 651 | 39.0% |
| Blaskogabyggd | Reykholt, Laugarvatn | 516 / 1,453 | 35.5% |
| Hrunamannahreppur | Fludir | 293 / 912 | 32.1% |
| Rangarthing eystra | Hvolsvollur | 659 / 2,142 | 30.8% |
| Hornafjordur | Hofn | 806 / 2,631 | 30.6% |
| Reykjanesbaer | Keflavik and Njardvik | 6,931 / 22,697 | 30.5% |
| Reykjavik | Reykjavik | 30,065 / 139,804 | 21.5% |
| Akureyri | Akureyri | 1,941 / 20,284 | 9.6% |
| Gardabaer | Gardabaer | 1,583 / 20,724 | 7.6% |
Source: Statistics Iceland table MAN04203, January 1, 2026. Foreign-citizen counts and shares calculated by Guide to Iceland. Selected municipalities are shown.
In Myrdalshreppur, the municipality containing Vik, foreign citizens outnumbered Icelandic citizens. These figures describe citizenship across the whole municipality, rather than the nationality or immigration status of people in Vik alone.
Is Iceland's Population Aging?
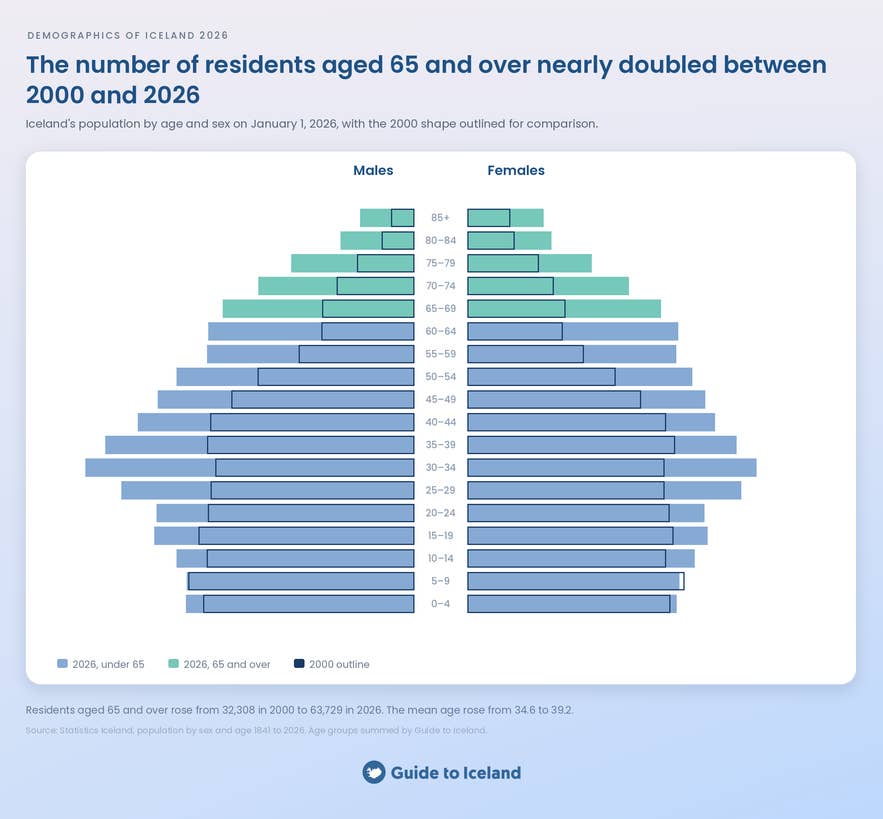
Iceland's population is aging. The mean age rose from 34.6 in 2000 to 39.2 in 2026, while the share of residents aged 65 and over increased from 8.9% in 1971 to 16.2% in 2026.
| Age measure | 1971 | 2000 | 2026 |
|---|---|---|---|
| 0–19 years | 42.2% | 31.1% | 24.1% |
| 20–64 years | 48.9% | 57.3% | 59.8% |
| 65 and over | 8.9% | 11.6% | 16.2% |
| Number aged 65 and over | 18,135 | 32,308 | 63,729 |
| People aged 0–19 or 65+ per 100 aged 20–64 | 104 | 75 | 67 |
Source: Statistics Iceland, population by age. Percentages are rounded.
The final row is an age-based dependency ratio. It compares younger and older residents with people aged 20–64. It does not count how many people actually work or depend financially on others.
Although the older population has grown, the combined ratio has fallen because children and teenagers now make up a much smaller share of residents.
Are There More Men or Women in Iceland?
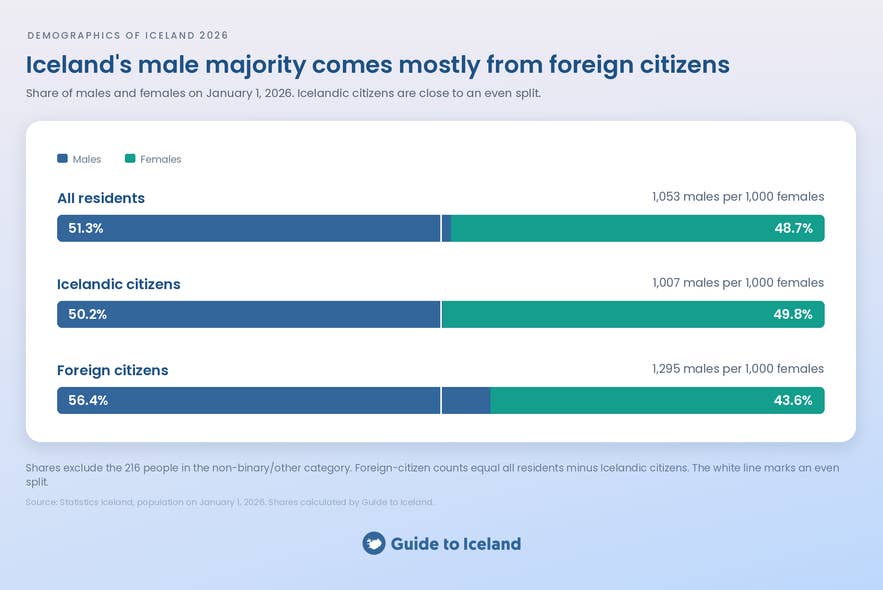
Statistics Iceland recorded 202,181 males, 191,927 females, and 216 people in its non-binary/other category on January 1, 2026. Our calculation gives about 1,053 males for every 1,000 females.
Icelandic citizens were almost evenly balanced: 162,379 males and 161,196 females. The overall difference was concentrated among foreign citizens, about 56% of whom were male. Our guide to gender equality looks at how women and men fare in Icelandic society.
How Many Children Are Born in Iceland?
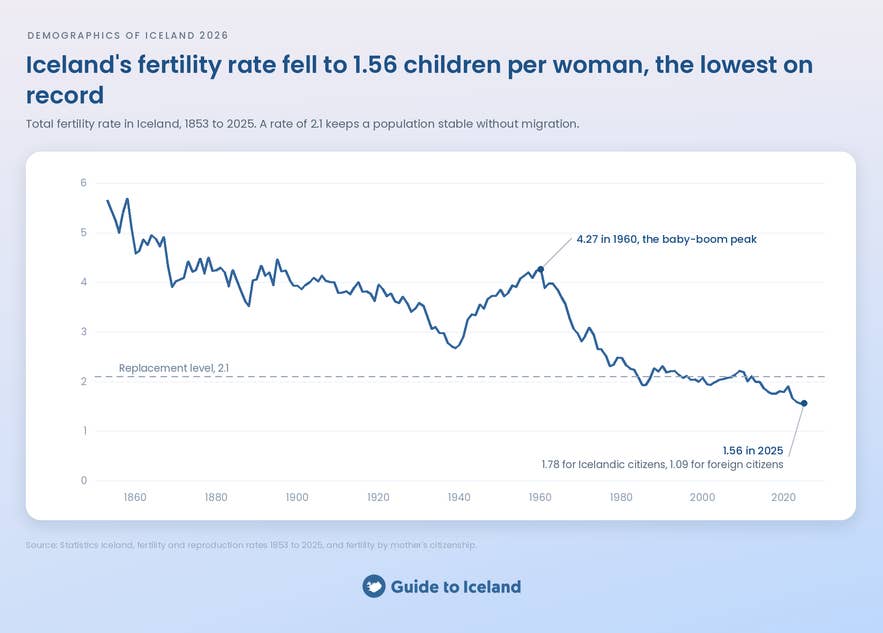
Statistics Iceland's 2025 birth statistics recorded 4,387 live births, fewer than the 4,916 recorded in 1960, when the population was less than half its current size.
The total fertility rate was 1.56 children per woman in both 2024 and 2025, the lowest recorded since the series began in 1853. It remained close to the replacement level of 2.1 for much of 1990–2012.
The total fertility rate estimates how many children a woman would have if the birth rates measured that year continued throughout her childbearing years. It does not describe how many children women have already had.
In 2025, the rate was 1.78 for women with Icelandic citizenship and 1.09 for women with foreign citizenship.
Parents are also older. The mean age of first-time mothers rose from 22.1 in 1981 to 29.2 in 2025. About two in three babies, 2,860 of the 4,387 recorded in 2025, were born to unmarried mothers. Unmarried does not necessarily mean that the parents live apart.
What Is the Life Expectancy in Iceland?
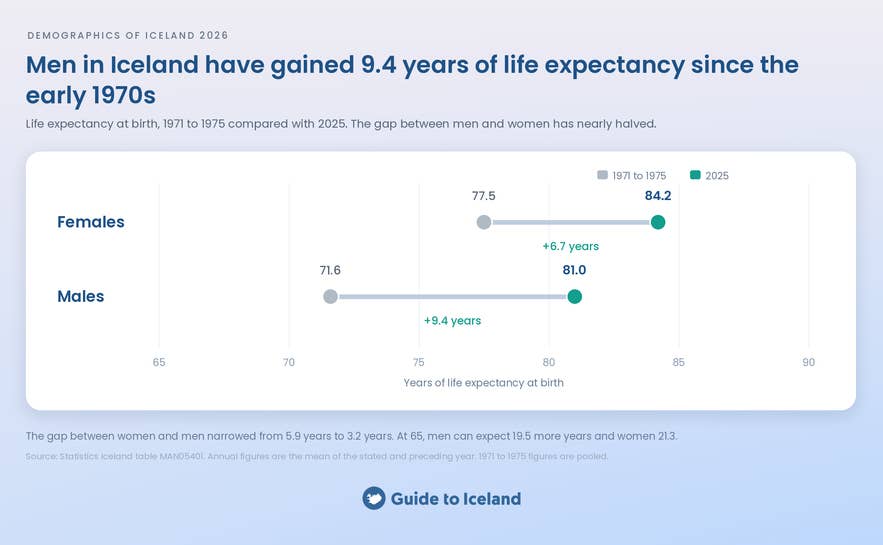
According to Statistics Iceland's life tables, life expectancy at birth in 2025 was 81.0 years for males and 84.2 years for females. In 1971–1975, the figures were 71.6 and 77.5 years respectively. Our calculations show that the gap narrowed from 5.9 years to 3.2 years.
At age 65, remaining life expectancy in 2025 was 19.5 years for males and 21.3 years for females. These figures describe additional years of life for people who have already reached 65.
Annual figures are the mean of the estimates for the stated year and the preceding year. The 1971–1975 figures use pooled data for that five-year period. These estimates describe lifespans under the mortality conditions measured, rather than predicting exactly how long an individual will live.
How Has Immigration Changed Iceland?
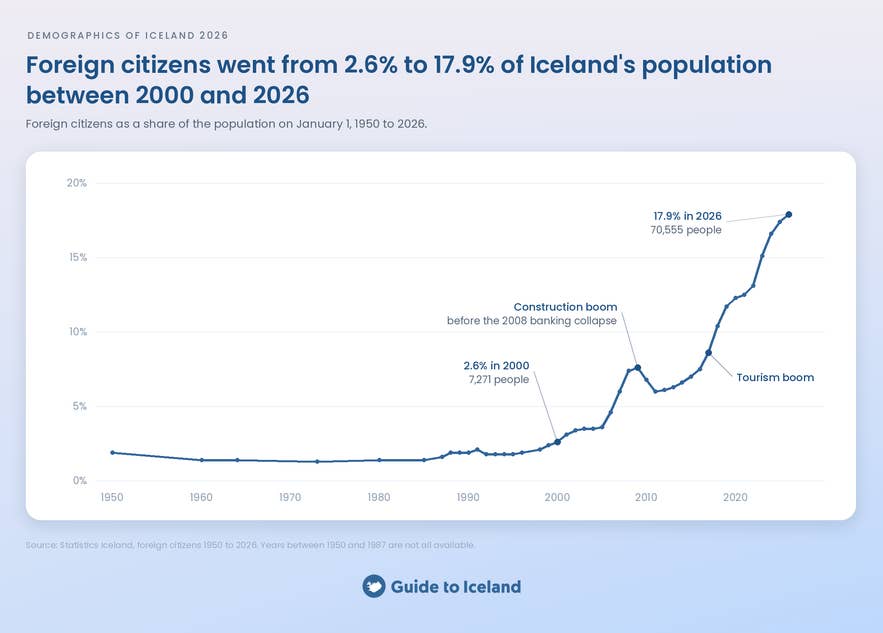
Statistics Iceland's citizenship figures counted 70,555 foreign citizens on January 1, 2026, almost ten times the 7,271 recorded in 2000. For much of the second half of the twentieth century, foreign citizens made up around 2% of the population.
The share increased during the construction boom before the 2008 banking collapse and again during the subsequent expansion of tourism. Growth continued beyond the tourism boom, although the pandemic interrupted international travel and migration.
Iceland's official guidance on working in the country explains that citizens of other EEA countries can work in Iceland without a work permit. About seven in ten foreign citizens, approximately 49,200, held citizenship of another EEA country in 2026.
People from outside the EEA arrive through several routes, including work permits, family reunification, and international protection. Our guides explain how to move to Iceland and how to find a job in Iceland.
What Is the Difference Between Foreign Citizens and Immigrants?
Both groups are residents of Iceland. "Foreign citizen" describes citizenship. "Immigrant" describes a person's birthplace and family background. Neither term, by itself, tells you what residence permit a person holds.
A person who moves to Iceland and later becomes an Icelandic citizen can still count as an immigrant. A child born in Iceland who holds only foreign citizenship counts as a foreign citizen but not as a first-generation immigrant.
Statistics Iceland publishes several measures, each answering a different question.
| Measure | Definition | Residents, Jan 1, 2026 | Share |
|---|---|---|---|
| Foreign citizens | Residents without Icelandic citizenship, including some children born in Iceland | 70,555 | 17.9% |
| First-generation immigrants | People born abroad whose parents and grandparents were also born abroad | 77,226 | 19.6% |
| First- and second-generation immigrants | First-generation immigrants plus children born in Iceland to two immigrant parents | 85,577 | 21.7% |
| Immigrants, their children, and people with one foreign-born parent | The preceding groups plus residents with one foreign-born parent | 107,865 | 27.4% |
Source: Statistics Iceland, population by citizenship and origin. Combined counts and percentages calculated by Guide to Iceland.
Naturalization helps explain why the immigrant count is larger than the foreign-citizen count. About 17,800 people acquired Icelandic citizenship between 1991 and 2025. The largest groups included former Polish, Filipino, and Thai citizens. Naturalizations reached a record 1,085 in 2025.
Statistics Iceland also recorded 279,639 residents who were born in Iceland to two Iceland-born parents, representing 70.9% of the population.
What Are Iceland's Largest Foreign Nationalities?
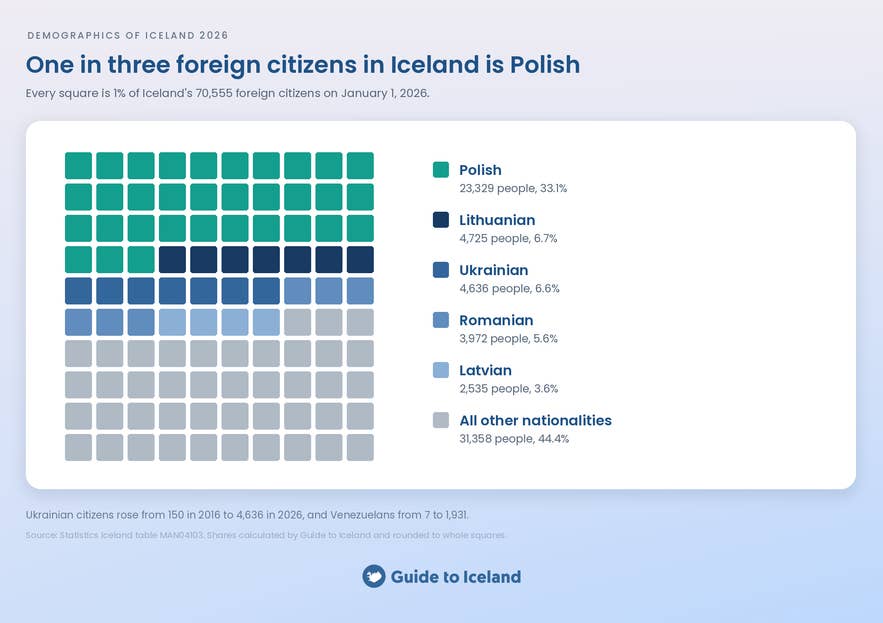
Polish citizens are Iceland's largest foreign-nationality group by a wide margin. They make up about one in three foreign citizens and 5.9% of the country's total population.
The first two numeric columns count residents by citizenship. The final column uses a different measure: first-generation immigrants born in each country, including those who have since acquired Icelandic citizenship.
| Citizenship | 2016 | 2026 | First-generation immigrants born in the corresponding country, 2026 |
|---|---|---|---|
| Polish | 11,451 | 23,329 | 23,055 |
| Lithuanian | 1,682 | 4,725 | 3,801 |
| Ukrainian | 150 | 4,636 | 4,719 |
| Romanian | 399 | 3,972 | 3,370 |
| Latvian | 736 | 2,535 | 2,472 |
| Venezuelan | 7 | 1,931 | 1,961 |
| Spanish | 456 | 1,884 | 1,381 |
| Portuguese | 605 | 1,805 | 1,422 |
| Filipino | 518 | 1,716 | 2,889 |
| German | 863 | 1,455 | 1,491 |
| Vietnamese | 241 | 1,188 | 1,814 |
| Czech | 249 | 1,155 | 1,148 |
| American | 505 | 1,113 | 1,442 |
| Italian | 226 | 1,076 | 806 |
| Croatian | 48 | 976 | 817 |
| Palestinian | 10 | 926 | 822 |
| British | 634 | 925 | 1,154 |
| Greek | 40 | 919 | 821 |
| Hungarian | 216 | 835 | 771 |
| Danish | 830 | 825 | 646 |
Sources: Statistics Iceland table MAN04103 for citizenship and MAN43004 for first-generation immigrants by birthplace. Figures refer to January 1. The 20 largest foreign citizenship groups in 2026 are shown.
The columns do not count the same people. Differences can reflect naturalization, birth in another country, or birth in Iceland, as well as Statistics Iceland's definition of a first-generation immigrant. The difference between two columns is therefore not a direct count of people who have naturalized.
Which Refugee Communities Live in Iceland?
Iceland's refugee communities include people from Ukraine, Venezuela, Palestine, Syria, Afghanistan, Iraq, and Somalia. They have arrived through asylum, refugee resettlement, temporary protection, and family reunification.
| Country of origin | Refugees recorded by UNHCR, end of 2025 |
|---|---|
| Ukraine | 4,664 |
| Venezuela | 1,209 |
| Palestine | 847 |
| Syria | 506 |
| Afghanistan | 331 |
| Somalia | 210 |
| Iraq | 122 |
Source: UNHCR Refugee Data Finder, end of 2025. Selected figures presented by Guide to Iceland.
These figures count refugees by country of origin rather than residents by citizenship. UNHCR's refugee category includes people granted temporary or subsidiary protection.
As described in UNHCR's account of Iceland's protection policies, Iceland introduced collective temporary protection for people fleeing Ukraine in March 2022, following Russia's full-scale invasion. Most Venezuelan asylum-seekers received subsidiary protection until the end of 2022, before Iceland changed its policy in 2023.
Palestinian refugee families have also reunited in Iceland, including families from Gaza. The Directorate of Immigration reports that Iceland prioritized Palestinian family reunification applications from October 2023.
How Many People Move to and From Iceland?
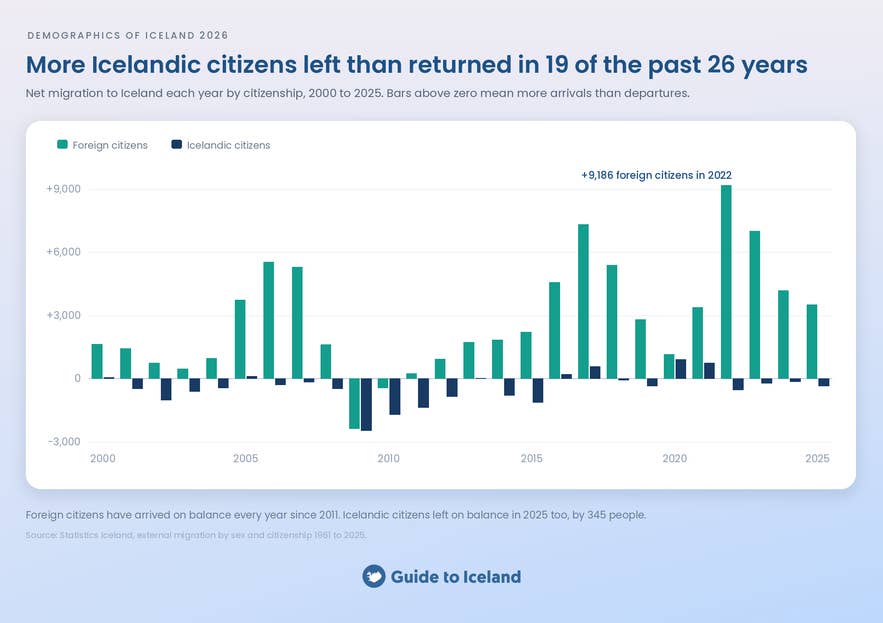
Statistics Iceland's migration figures recorded 18,674 arrivals and 15,507 departures in 2025. Icelandic citizens had net emigration in six of the eight years from 2018 to 2025, including a net loss of 345 in 2025. Foreign citizens had net immigration every year from 2011 to 2025.
| Year | Arrivals | Departures | Net migration, Icelandic citizens | Net migration, foreign citizens |
|---|---|---|---|---|
| 2025 | 18,674 | 15,507 | −345 | +3,512 |
| 2024 | 19,789 | 15,745 | −139 | +4,183 |
| 2023 | 21,561 | 14,771 | −214 | +7,004 |
| 2022 | 22,209 | 13,549 | −526 | +9,186 |
| 2021 | 15,416 | 11,288 | +747 | +3,381 |
| 2020 | 15,249 | 13,170 | +912 | +1,167 |
Source: Statistics Iceland, external migration. Figures cover calendar years.
Migration flows among foreign citizens are substantial. In 2025, 14,073 arrived and 10,561 departed: roughly three departures for every four arrivals. These were separate flows, so the figures do not show that three-quarters of that year's newcomers subsequently left.
How Many Icelanders Live Abroad?
According to Registers Iceland, 51,853 Icelandic citizens were registered as living abroad on December 1, 2025. That was equivalent to about one abroad for every six Icelandic citizens living in Iceland.
Around six in ten lived in the other Nordic countries. Nordic arrangements make it easier for Icelanders to live, study, and work there, although access to benefits depends on the country, the benefit, and the person's circumstances.
Denmark had the largest community of Icelandic citizens abroad, followed by Norway and Sweden. Statistics Iceland's migration data show that in 2025, 1,997 Icelandic citizens moved to Denmark and 1,502 moved from Denmark to Iceland, the largest two-way flow of Icelandic citizens with any country.
Norway became a particularly important destination after the 2008 banking collapse, when employment opportunities in Iceland contracted.
Who Were the Vesturfarar?
The Vesturfarar were Icelanders who emigrated to North America, mainly during the emigration wave of 1870–1914. Historical research published by the University of Iceland's Science Web describes how volcanic ash, cold years, and land shortages helped push an estimated 15,000 to 20,000 people to leave, roughly 20% to 25% of the population.
Most settled in Canada, particularly in what is now Manitoba. Icelandic settlers founded New Iceland on the shore of Lake Winnipeg in 1875, with Gimli as its center.
Canada's 2016 census counted 101,795 people reporting Icelandic ancestry, about a quarter of Iceland's 2026 population. Only 1,285 reported Icelandic as their sole mother tongue.
What Religions Are Practiced in Iceland?
Christianity is Iceland's largest registered religious affiliation, with about two in three residents registered in Christian organizations. Membership, however, does not necessarily indicate personal belief or religious practice.
About one in five residents falls into the registry's "Other and not specified" category. This includes unknown affiliation and membership of unrecognised organizations. It is not a count of people with no religious beliefs.
What Does the Religious Registry Say?
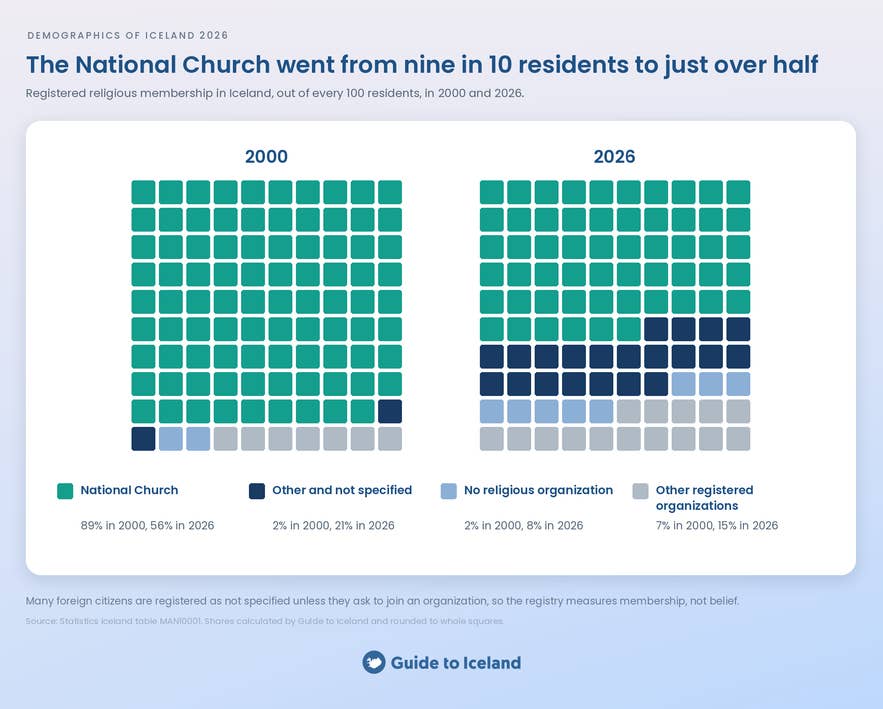
The national register records membership of religious and life-stance organizations, alongside categories for no membership and other or unspecified affiliation. The table shows figures on January 1, 2026.
| Organization or registry category | Members | Share | Share in 2000 |
|---|---|---|---|
| Evangelical Lutheran Church of Iceland (Thjodkirkjan) | 222,012 | 56.3% | 88.7% |
| Other and not specified | 81,593 | 20.7% | 1.8% |
| No religious organization | 30,257 | 7.7% | 2.1% |
| Independent Lutheran congregations, three churches | 20,789 | 5.3% | 3.8% |
| Roman Catholic Church | 15,558 | 3.9% | 1.4% |
| Icelandic Ethical Humanist Association (Sidmennt) | 6,387 | 1.6% | 0.0% |
| Asatruarfelagid (Norse pagan) | 6,158 | 1.6% | 0.1% |
| Pentecostal Church | 2,028 | 0.5% | 0.5% |
| Muslim organizations, four groups | 2,139 | 0.5% | 0.0% |
| Buddhist organizations, six groups | 1,663 | 0.4% | 0.2% |
| Orthodox parishes, four groups | 1,293 | 0.3% | 0.0% |
Source: Statistics Iceland table MAN10001. Selected organizations and categories are shown. Group totals and shares calculated by Guide to Iceland. A displayed 0.0% may represent a small, non-zero share.
The National Church's share fell by about 32 percentage points between 2000 and 2026, from 88.7% to 56.3%. Its membership also fell in absolute terms, from 247,420 to 222,012. Its most famous building, Hallgrimskirkja, remains a Reykjavik landmark.
Asatruarfelagid, founded in 1972 to revive the worship of the Norse gods, is the largest registered non-Christian religious organization in Iceland. Zuism, associated with a campaign to refund parish fees, had about 3,000 members in 2016 but had no registered members in the 2026 figures.
Membership affects public funding. Recognised religious and life-stance organizations receive a parish fee, or soknargjald, from general tax revenue for eligible registered members aged 16 and over. Registration therefore has a funding consequence, but it does not necessarily describe a person's faith.
Why Can the Registry Miss Immigrants' Religious Affiliations?
The "Other and not specified" category grew from 5,094 people in 2000 to 81,593 in 2026.
Official guidance for foreign citizens explains that they are initially registered with unspecified religious affiliation unless they request registration in an organization. A Catholic from Poland, an Orthodox Christian from Romania, or a Muslim from Syria can therefore remain unspecified despite having a religious affiliation.
The registry measures recorded membership. It cannot establish the religious beliefs of everyone living in Iceland.
What Are the Main Religions in Immigrants’ Countries of Origin?
Countries of origin have different religious traditions, according to Pew Research Center's estimates for 2020. The table describes selected countries themselves, rather than the religions of immigrants living in Iceland.
| Country | Christian | Muslim | Buddhist | No religious affiliation |
|---|---|---|---|---|
| Poland | 91.2% | <0.1% | <0.1% | 8.6% |
| Ukraine | 83.4% | 0.6% | 0.3% | 15.1% |
| Lithuania | 92.2% | <0.1% | <0.1% | 7.1% |
| Romania | 98.5% | 0.4% | <0.1% | 0.9% |
| Philippines | 91.5% | 6.5% | <0.1% | <0.1% |
| Latvia | 77.3% | 0.7% | <0.1% | 17.0% |
| Venezuela | 88.1% | <0.1% | <0.1% | 9.7% |
| Vietnam | 8.3% | <0.1% | 23.0% | 67.7% |
| Germany | 56.2% | 6.5% | 0.3% | 36.1% |
| United States | 64.0% | 1.2% | 1.3% | 29.7% |
| Thailand | 1.0% | 4.5% | 94.4% | <0.1% |
| Syria | 3.8% | 94.2% | <0.1% | 2.0% |
Source: Pew Research Center, "How the Global Religious Landscape Changed From 2010 to 2020," June 9, 2025, Appendix B. © 2025 Pew Research Center. Selected countries and categories presented by Guide to Iceland.
These are country-level estimates, not measurements of immigrants' religions in Iceland. Smaller religious categories are not shown, so rows may not total 100%.
What Do Icelanders Actually Believe In?
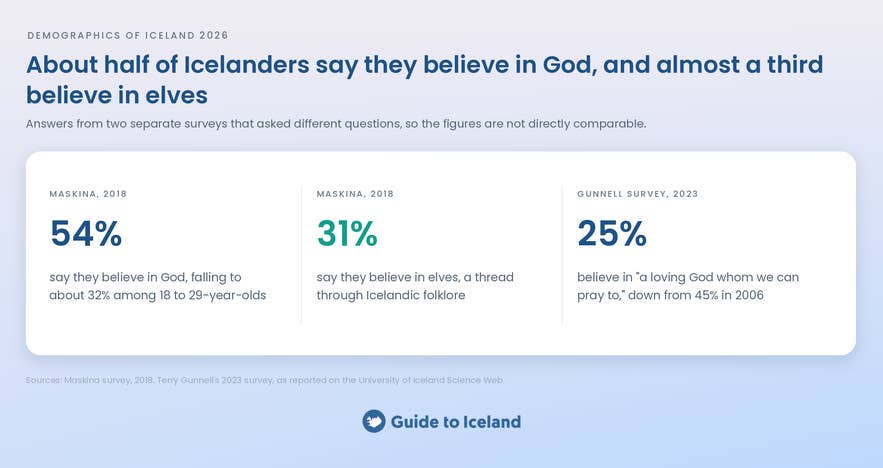
Surveys of Icelanders' beliefs give a different picture from registration. In a 2018 Maskina survey, 54% said they believed in God, compared with about 32% among 18- to 29-year-olds. In the same survey, about 31% said they believed in elves. This belief is a thread that runs through Icelandic folklore.
A 2023 survey led by folklorist Terry Gunnell found about 25% believed in "a loving God whom we can pray to." That was down from 45% in 2006 and 38% in 2007, according to Gunnell's account of the findings.
The Maskina and Gunnell surveys asked different questions, so their percentages should not be treated as directly comparable measurements.
What Languages Are Spoken in Iceland?
Icelandic is Iceland's national and official language. The Arni Magnusson Institute for Icelandic Studies explains that its written form has changed relatively little over the centuries, allowing Icelanders to read the medieval Icelandic sagas in their original language.
Individuals, specialist groups, and language organizations develop Icelandic words for new concepts. A familiar example is tolva, meaning computer, formed from words associated with "number" and "prophetess."
Polish is one of Iceland's largest community languages, reflecting the size of the Polish population. Other community languages include Lithuanian, Ukrainian, Romanian, Latvian, Spanish, Tagalog, and Vietnamese. Citizenship figures, however, do not provide exact counts of speakers.
English is widely spoken and used in tourism and other workplaces, allowing some newcomers to work without Icelandic. The OECD's study of immigrant integration in Iceland highlights the importance of access to Icelandic teaching and opportunities to use the language.
How Do Icelandic Names Work?
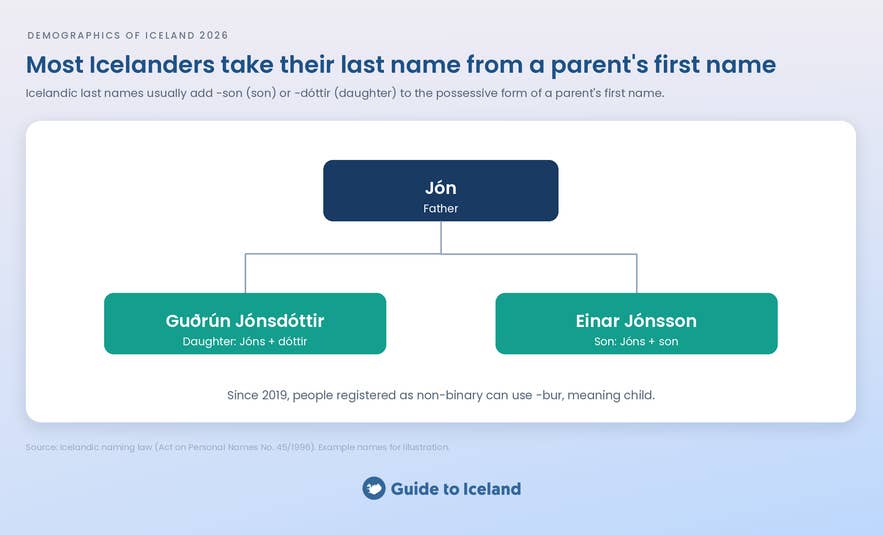
Most Icelanders do not have an inherited family name. A child's last name is commonly formed from the father's or mother's first name, in its possessive form, plus -son or -dóttir. Jón's children might therefore be Guðrún Jónsdóttir and Einar Jónsson.
Since 2019, people registered as non-binary have been able to use the suffix -bur, meaning child. Icelanders commonly use first names in both formal and informal settings, and telephone directories traditionally sort people by first name. Our guide to Icelandic names answers common questions.
First names that are not already approved generally require approval from the Personal Names Committee, or Mannanafnanefnd, which applies the rules on Icelandic names.
The following were the most common first given names on January 1, 2023.
| Rank | Male names | People | Female names | People |
|---|---|---|---|---|
| 1 | Jón | 5,052 | Anna | 4,782 |
| 2 | Sigurður | 4,073 | Guðrún | 4,472 |
| 3 | Guðmundur | 3,838 | Kristín | 3,383 |
| 4 | Gunnar | 3,074 | Sigríður | 3,192 |
| 5 | Ólafur / Olav | 2,743 | Margrét / Margrjet / Margret | 2,838 |
Source: Statistics Iceland, names on January 1, 2023. Counts cover all ages and use the first given name. Displayed spelling variants are grouped together.
Where Are Icelanders Descended From?
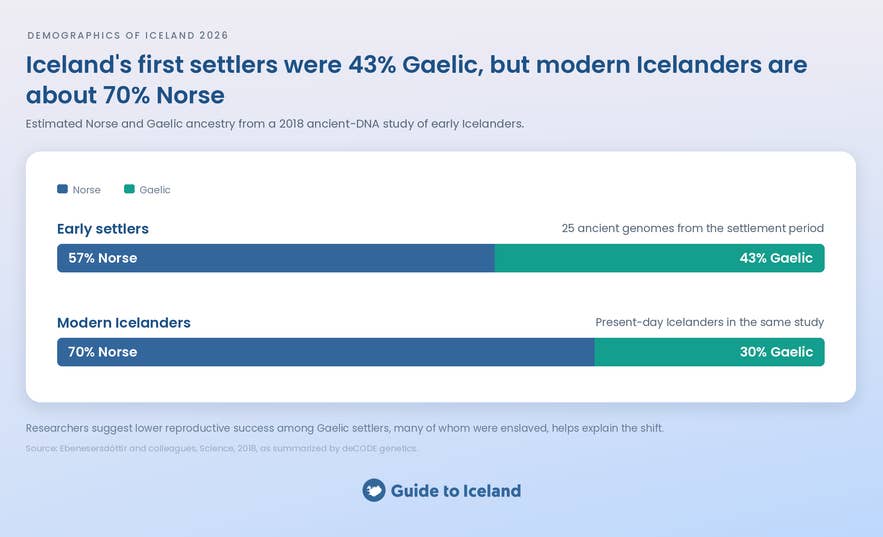
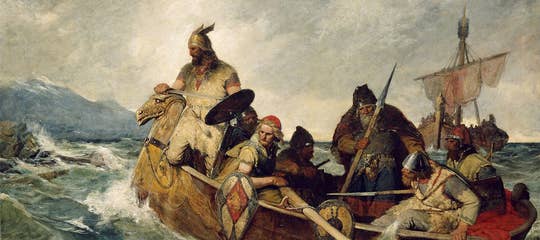
Iceland was settled mainly between about 870 and 930 by people of Norse and Gaelic origin. Settlers came from Norway, Ireland, and Scotland, and included enslaved people brought from the British Isles. The Settlement Exhibition in Reykjavik preserves remains from the settlement period.
A 2018 ancient-DNA study by Ebenesersdóttir and colleagues estimated that 25 early settlers had about 57% Norse and 43% Gaelic ancestry. The modern Icelanders studied had about 70% Norse ancestry.
The researchers suggested that lower reproductive success among Gaelic settlers, many of whom were enslaved, could help explain the difference. Later immigration from Denmark may also have contributed.
Iceland's small population and extensive genealogical records have made it valuable for genetic research. The Islendingabok database brings together genealogical information from sources including church and census records. An app developed in 2013 used the database to help Icelanders check whether they were related.
Our calculations using Statistics Iceland's population-background figures put about 27% of residents in the combined groups of immigrants, their Iceland-born children, and people with one foreign-born parent. For more on national identity, read what makes an Icelander.
How We Did This Study
Population statistics come from Statistics Iceland and its published releases. The original extraction was dated September 27, 2026. Selected tables were checked again on October 14, 2026.
Population figures refer to January 1, 2026 unless labeled otherwise. Births, migration, and naturalizations cover calendar years. Other reference dates are stated beside the figures.
Guide to Iceland calculated percentage changes, shares, grouped totals, and ratios from the source counts. Percentages are rounded. Municipality foreign-citizen counts equal total residents minus Icelandic citizens.
The growth analysis covers all 62 municipalities using 2026 boundaries. Municipalities are ranked by population gain during 2011–2026, with a separate 2016–2026 comparison. Growth rates use starting populations, including the combined rate. Contributions divide each gain by national net growth and can be negative.
The main analysis uses the population series revised from 2011 onwards. The 2006 town comparisons cross a counting-method change and may involve different urban boundaries. Population changes can include statistical adjustments and do not measure migration alone.
Religious registration from Statistics Iceland measures membership, not belief. Pew's 2020 estimates describe countries of origin and are not applied to immigrants in Iceland. The 2018 Maskina and 2023 Gunnell surveys asked different questions and are reported separately.
Refugee counts use UNHCR's end-of-2025 category, including temporary and subsidiary protection. Citizens abroad use Registers Iceland's December 2025 figures. Canadian ancestry figures use the 2016 census. Other sources and definitions are linked beside the relevant claims.
Explore More Guide to Iceland Studies
Iceland's population changes are closely connected to its economy, workforce, and communities. Our study of Iceland's economy examines the roles of fishing, energy, and tourism.
Other studies explore travel planning and visitor experiences through data:
These figures offer context for the communities you'll encounter while traveling around Iceland. Tours, travel packages, and car rentals offer different ways to explore the country, while hotels in Reykjavik provide a base in its largest city.

Guide to Iceland Editorials is the shared byline for our content team. We use it on pieces several people worked on together, where no single writer owns the article, and on anything rewritten often enough that a personal byline would be misleading. We also publish our original data studies under this profile. Each study answers a question travelers ask about Iceland, using primary sources such as booking records, traveler reviews and public datasets, and every study is quality checked by human experts before it's published. Everything under this byline is researched and reviewed by people who live and work in Iceland. If you spot something out of date or want to suggest a correction, message us and it reaches the whole team.