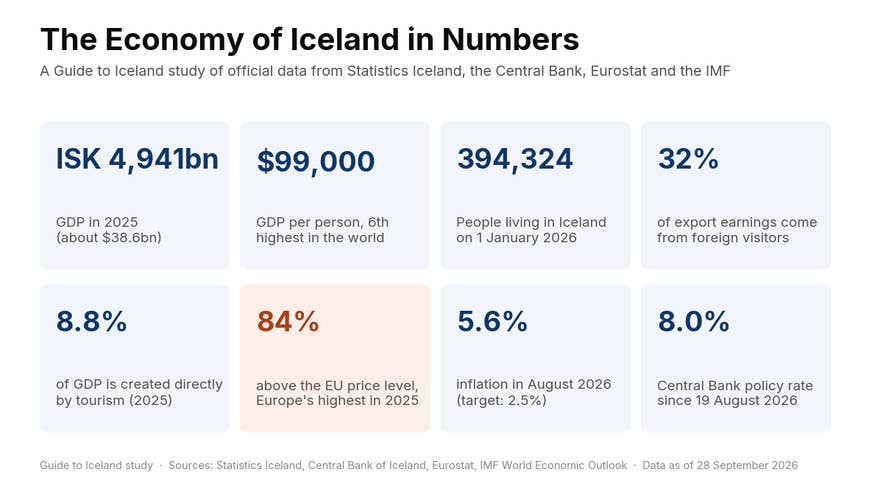
Iceland runs a rich-world economy on a population the size of a mid-sized European city. In 2025 its average population of 391,884 produced ISK 4,941 billion of goods and services, about $38.6 billion, which the IMF puts at $99,000 per person, the sixth highest figure on Earth.
That money comes from three places: the sea, cheap renewable electricity and visitors. This Guide to Iceland study pulls the official numbers together from Statistics Iceland, the Central Bank of Iceland, Eurostat and the IMF to show how the economy of Iceland works, how it crashed in 2008, why tourism became its largest export, and what all of it means for the price of your coffee in Reykjavík. It pairs with our study of the demographics of Iceland, which covers who lives here and where they came from.
We recommend reading this before you set a budget for your trip. The same forces that make Iceland wealthy make it the most expensive country in Europe to visit, and knowing why helps you find the places where your money goes further.
How Big Is the Economy of Iceland?
Iceland's gross domestic product was ISK 4,941 billion in 2025, according to Statistics Iceland. That is roughly €34 billion at the 2025 average exchange rate, about four-fifths the size of Estonia's economy and under 1% of Germany's.
Per person, the picture flips. GDP works out at ISK 12.6 million per resident, and in US dollars only Liechtenstein, Luxembourg, Ireland, Switzerland and Singapore rank higher in the IMF's World Economic Outlook. Adjusted for Iceland's high prices, GDP per person at purchasing power parity is about $80,700, still well above the EU average of about $65,300.
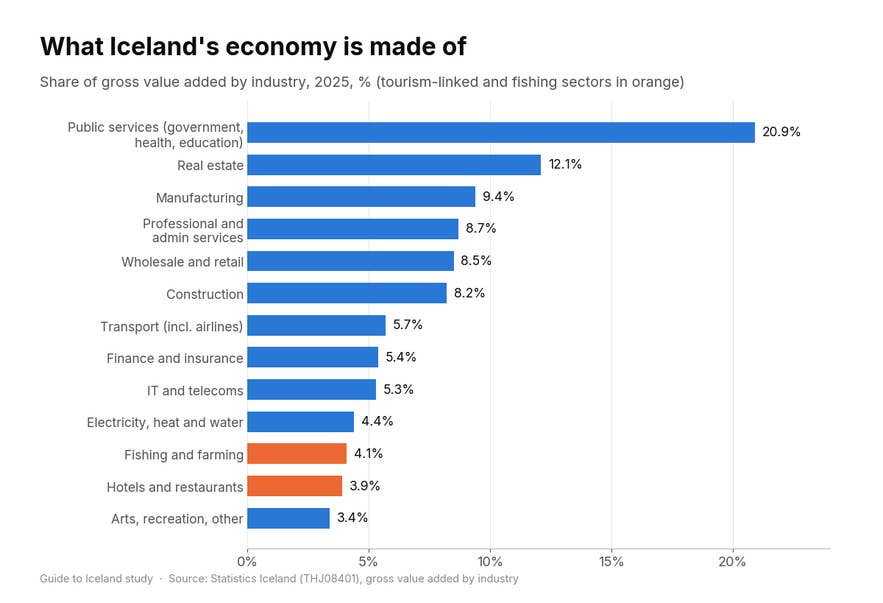
Most of that output comes from services that visitors never notice. Public services (government, health and education) make up 20.9% of the economy's gross value added and real estate 12.1%. The industries Iceland is famous for are smaller than you might expect: fishing and farming together produce 4.1%, and hotels and restaurants 3.9%.
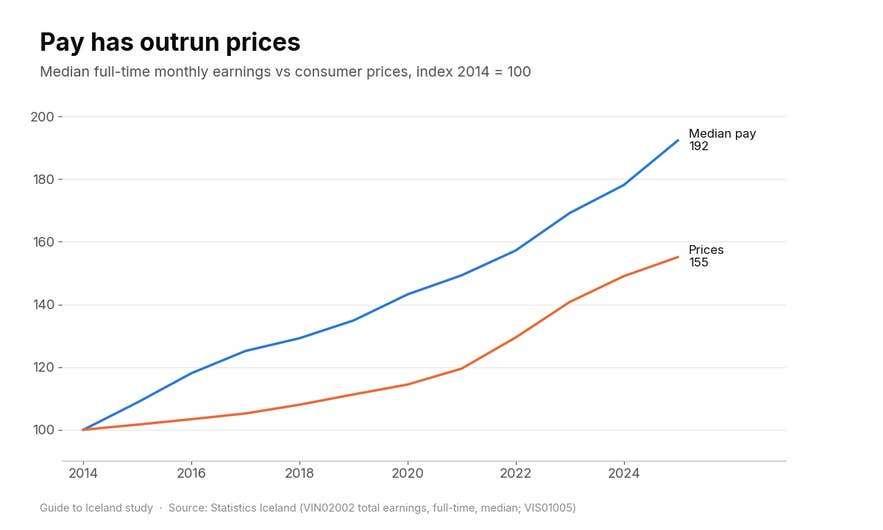
The typical worker shares in the wealth. The median full-time employee earned ISK 948,000 a month in total pay in 2025 (about €6,550). Earnings have risen 92% since 2014 while consumer prices rose 55%, so the median worker's real pay is about 24% higher than in 2014.
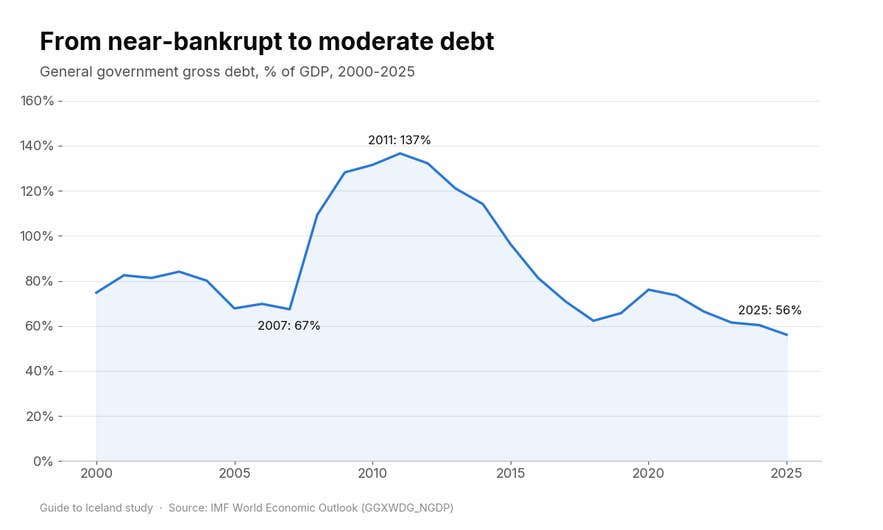
Public finances are in good shape for a country that nearly went bankrupt in 2008. The IMF puts gross government debt at 56% of GDP in 2025, down from a peak of 137% in 2011 and below the 67% of 2007, the year before the crash.
Cite This Study
The charts and data in this study are free to use under CC BY 4.0. Credit Guide to Iceland and link to this page. Every chart has an Embed button underneath it with ready-to-paste code.
How Fast Does Iceland's Economy Grow?
Fast, and unevenly. Real GDP grew by about 3% a year between 1995 and 2025, well ahead of most of Europe, but the path swings harder than almost anywhere else in the developed world.
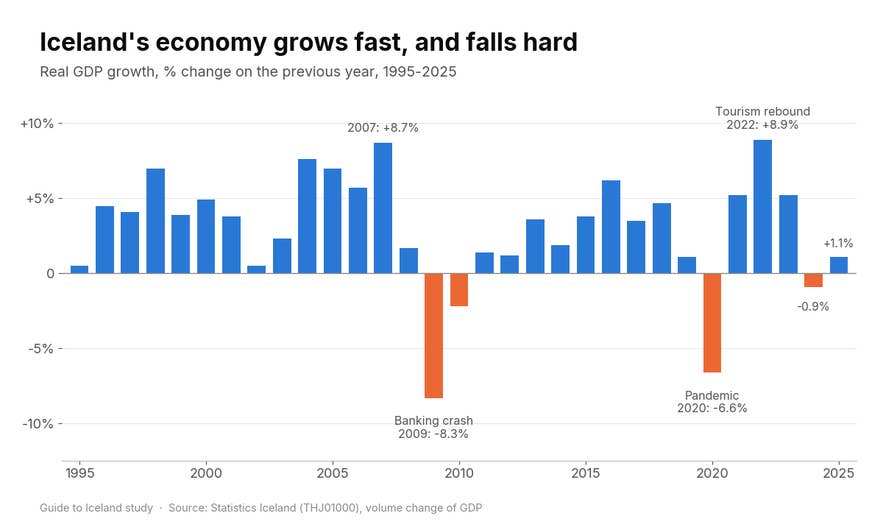
The economy grew 8.7% in 2007 at the peak of the banking boom, then shrank 8.3% in 2009 as the banks collapsed. It took until 2015 for output to climb back above its 2008 level. The pandemic cut GDP 6.6% in 2020, and the tourism rebound pushed growth to 8.9% in 2022, the fastest since 1971.
Growth has cooled since. GDP fell 0.9% in 2024 and grew 1.1% in 2025 (both still preliminary). The population is growing faster than output, up 41% since 2000 to 394,324 on 1 January 2026, so real GDP per person has slipped for two years in a row. Our demographics of Iceland study shows that immigration accounts for most of that growth.
What Does Iceland Export?
Iceland earned ISK 1,997 billion from exports in 2025, which is 40% of GDP. For a small island that imports nearly everything it doesn't fish, grow in a greenhouse or smelt, those export earnings pay for the cars, fuel, fruit and electronics that arrive by ship and plane.
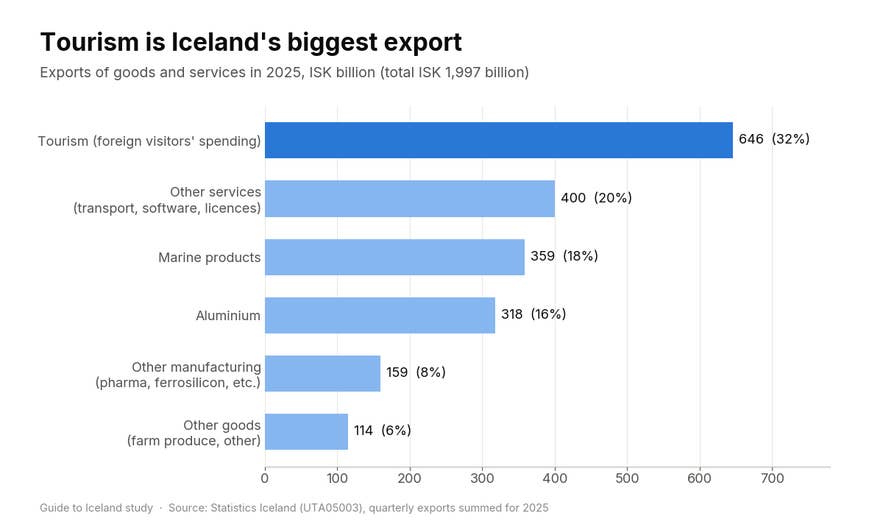
Foreign visitors' spending in Iceland brought in ISK 646 billion, or 32% of all export earnings. Marine products earned ISK 359 billion (18%) and aluminium ISK 318 billion (16%). Other manufactured goods, including pharmaceuticals and ferrosilicon, added ISK 159 billion.
The remaining services (ISK 400 billion, 20%) cover air and sea transport sold to foreigners, software and licensing income from intellectual property. They're the part of the economy most visitors never see, even though many of them flew in on an Icelandic airline and landed at Keflavík International Airport.
Is Fishing Still Important to Iceland's Economy?
Yes, but it no longer runs the country on its own. In 1949, fish made up 97% of everything Iceland exported as goods. By 2025 the share was 39%.
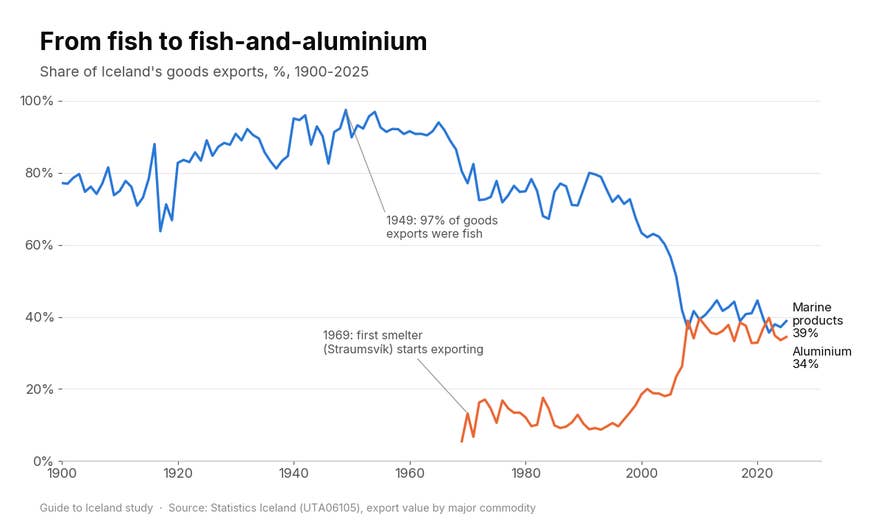
Fish built modern Iceland. Cod, herring and capelin financed the jump from one of Europe's poorest countries in 1900 to one of its richest by the 1970s, and the country fought three "Cod Wars" with Britain between 1958 and 1976 to push its fishing limit out to 200 nautical miles. Our history of Iceland tells the longer story.
Today fishing and fish processing together generate about 4.7% of the economy's gross value added. The industry lands less than in the herring years but earns more per tonne, thanks to a quota system that caps the catch and rewards quality. You'll taste the result in any Icelandic restaurant, especially the best seafood restaurants in Reykjavík, and you can join the boats yourself on one of the fishing tours in Iceland or try river angling with our guide to fishing in Iceland.
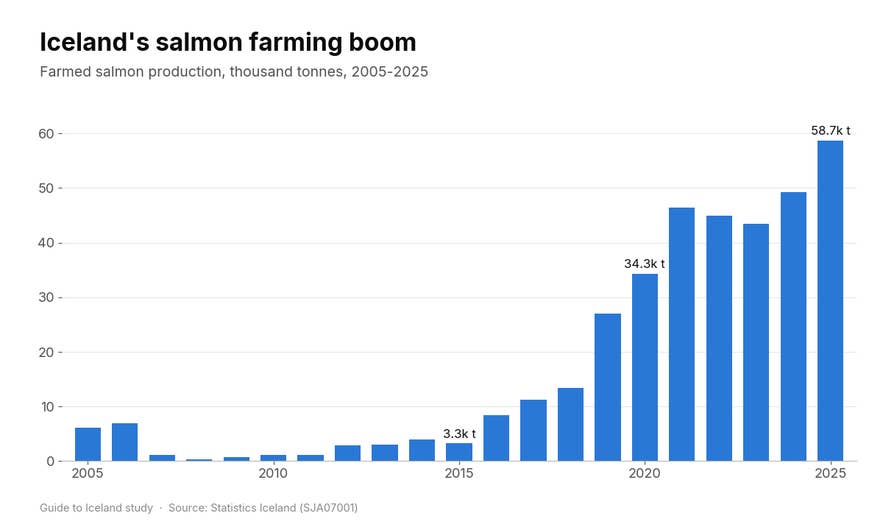
The newest growth is in fish farming. Iceland produced 58,717 tonnes of farmed salmon in 2025, eighteen times the 3,260 tonnes of 2015, mostly in the fjords of the Westfjords and East Iceland.
Drive the fjords of the east or the northwest, on the way to Ísafjörður for example, and you'll often see the round sea pens from the road.
Why Does Iceland Make So Much Aluminium?
Because Iceland has more cheap, clean electricity than its people could ever use. The country generated 19,603 gigawatt-hours in 2024, about 50,700 kilowatt-hours per resident, and the Government of Iceland describes it as the world's largest electricity producer per person. Nearly all of it is renewable: about 73% from hydropower and 27% from geothermal power. Our guide to geothermal power in Iceland explains how the plants work.
Aluminium smelting is essentially a way of exporting that electricity in solid form. Iceland has no bauxite. Ships bring in alumina, three smelters (at Straumsvík near Hafnarfjörður, Grundartangi in West Iceland and Reyðarfjörður in the East) turn it into metal, and ships take the metal to Europe.
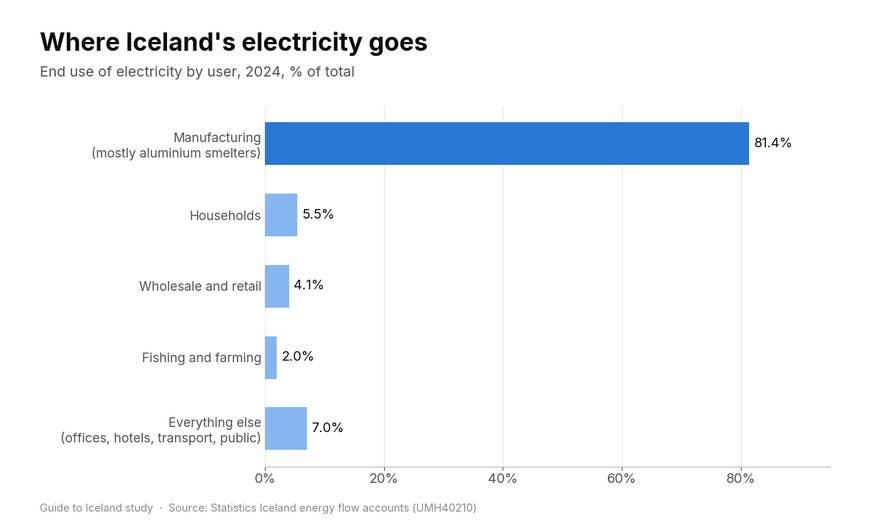
Manufacturing, which in Iceland means mostly aluminium smelting, used 81% of all electricity consumed in 2024, according to Statistics Iceland's energy accounts. Households used 5.5%. In 2019, the last year Statistics Iceland broke out the smelters separately, aluminium production alone took 66%.
For visitors, the same energy shows up in warmer ways. About 85% of Iceland's houses are heated with geothermal water, which is why hot showers are endless, public swimming pools are open year-round and the geothermal spas never run cold. The same heat feeds the best hot springs in Iceland, the hot springs travellers recommend most, the steaming geothermal areas and the Blue Lagoon, whose water comes from the neighbouring Svartsengi geothermal power station.
How Important Is Tourism to Iceland's Economy?
Tourism is now Iceland's single largest export industry. Tourism direct GDP came to 8.8% of total GDP in 2025 (a preliminary figure), and tourism accounted for 9.5% of all hours worked in the country, according to Statistics Iceland's tourism satellite accounts.
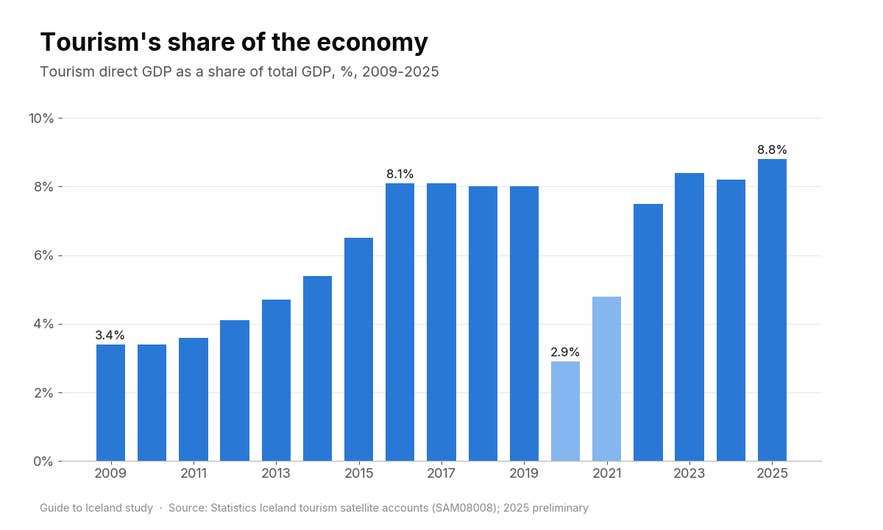
That share has more than doubled since 2009, when it was 3.4%. Tourism's share of value added actually eased in 2025, from 7.6% to 7.4%, and its share of hours worked fell from 10.2%, so the rise in the headline GDP figure comes mostly from taxes on tourism products and may be revised.
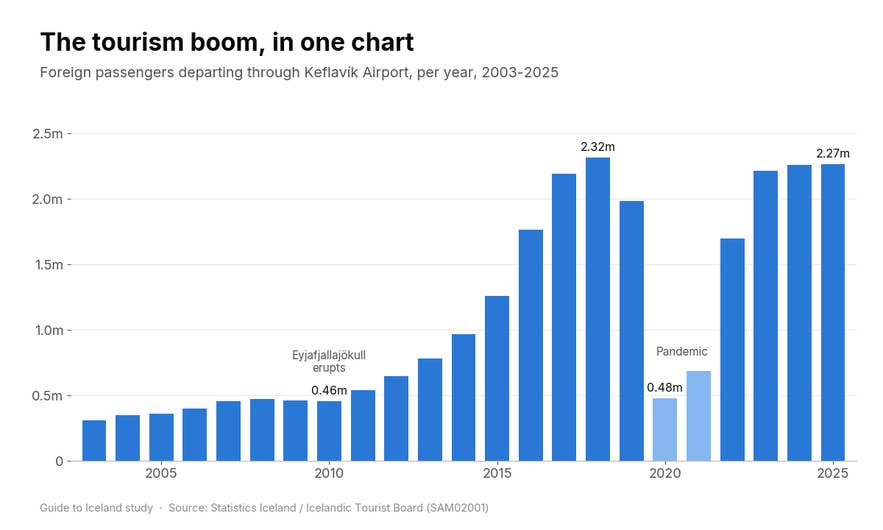
The boom started with a volcano. After Eyjafjallajökull erupted in 2010 and put Iceland on news channels around the world, foreign departures through Keflavík rose from 0.46 million that year to 2.32 million in 2018, a fivefold jump in eight years. The pandemic cut them to 0.48 million in 2020, and by 2025 they were back at 2.27 million.
Numbers have now levelled off. Foreign departures between January and July 2026 were 1.4% below the same months of 2025. Dividing 2025 tourism export earnings by foreign departures gives a rough figure of ISK 285,000 (about €2,000) spent inside Iceland per visitor.
That spending changed the shape of the economy. The Golden Circle tours, South Coast day trips, glacier hikes, ice caves and whale watching tours that fill a visitor's itinerary are now a sizeable industry, and many of the businesses behind them sit outside the capital. Growth on that scale has also brought pressure on roads, nature sites and housing, which our article on sustainable tourism in Iceland looks at.
When Do Most Visitors Come to Iceland?
Iceland's visitor economy is strongly seasonal. In 2025, 312,964 foreign passengers left through Keflavík in August against 120,016 in December, a ratio of 2.6 to 1.
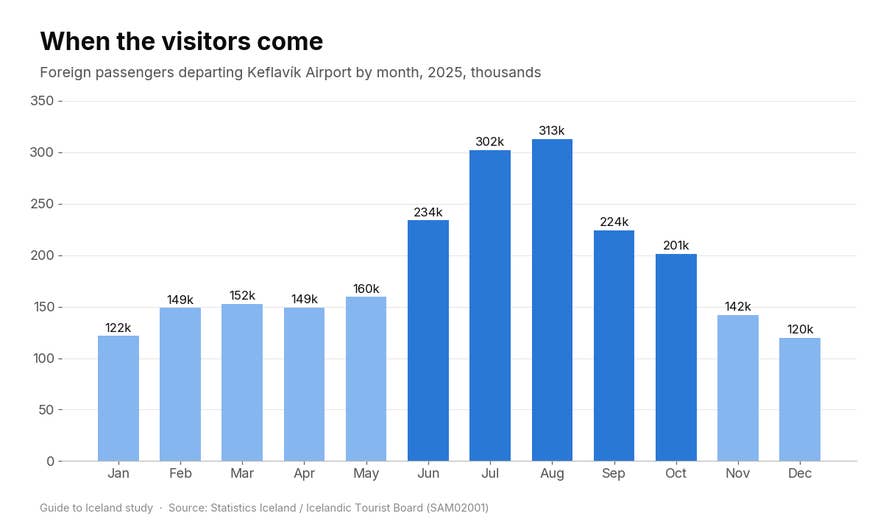
For travellers, the quieter months are the easiest way to beat both crowds and high-season prices. May brought about half as many foreign visitors as August, with long, bright evenings, while winter is the season for northern lights tours. Our guide to the best time to visit Iceland and our 26-year weather study weigh the trade-offs month by month.
What Happened to Iceland's Economy in 2008?
Iceland's three big banks, Kaupthing, Landsbanki and Glitnir, collapsed within a few days of each other in October 2008. They had grown their balance sheets to about ten times Iceland's GDP, according to the Bank for International Settlements, mostly by borrowing abroad, and when global credit markets froze there was no way for the state or the Central Bank to rescue them.
The fallout was severe. Unemployment rose from 2.5% in 2007 to 8.3% in 2010, inflation hit 12.4% in 2008, and the króna lost about half its value against the euro.
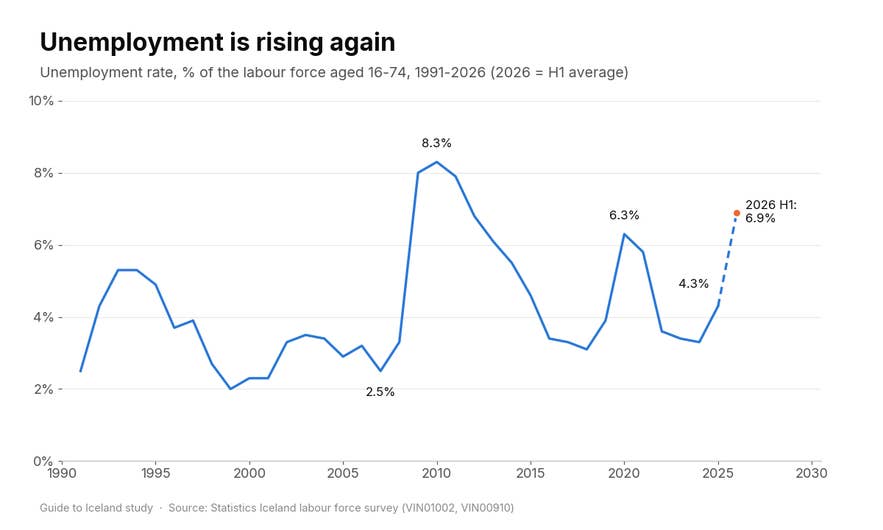
Unemployment fell almost as fast as it rose. By 2016 it was back at 3.4%, and after the pandemic spike to 6.3% in 2020 it dropped to 3.3% by 2024 before rising to 4.3% in 2025.
It has climbed further in 2026. The labour force survey put unemployment at 7.3% in the first quarter and 6.5% in the second, nearly double the 3.5% of a year earlier and the highest second-quarter rate since 2021. Young people have been hit hardest: unemployment among 16 to 24-year-olds reached 17.3% in the second quarter, up from 7.6%.
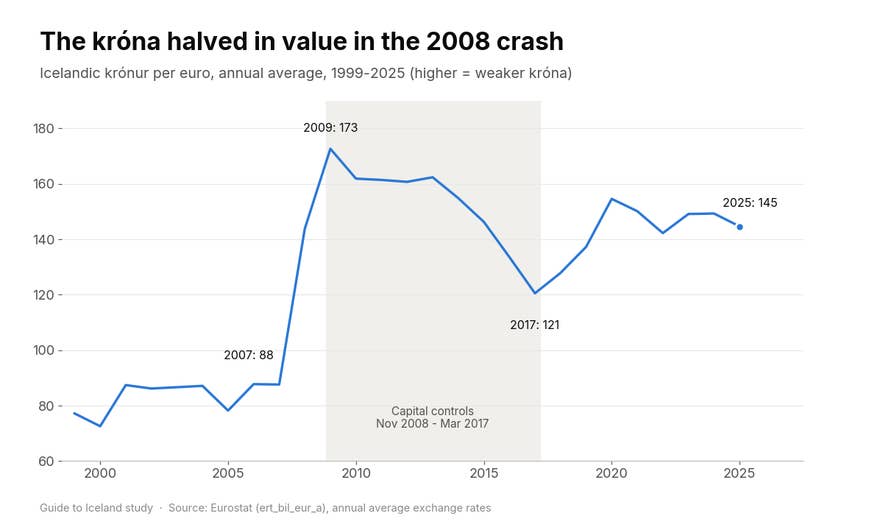
A euro cost ISK 88 on average in 2007 and ISK 173 in 2009. The IMF lent Iceland $2.1 billion, and the government imposed capital controls in November 2008 to stop money fleeing the country. Most controls were lifted in March 2017 and the last of them in 2019.
The crash also rebuilt the economy's balance. Banking and financial services made up 12.5% of gross value added in 2007 and just 3.7% in 2025, while hotels and restaurants grew from 1.6% to 3.9%. The weak króna made Iceland cheap for a few years, which helped light the fuse on the tourism boom that followed.
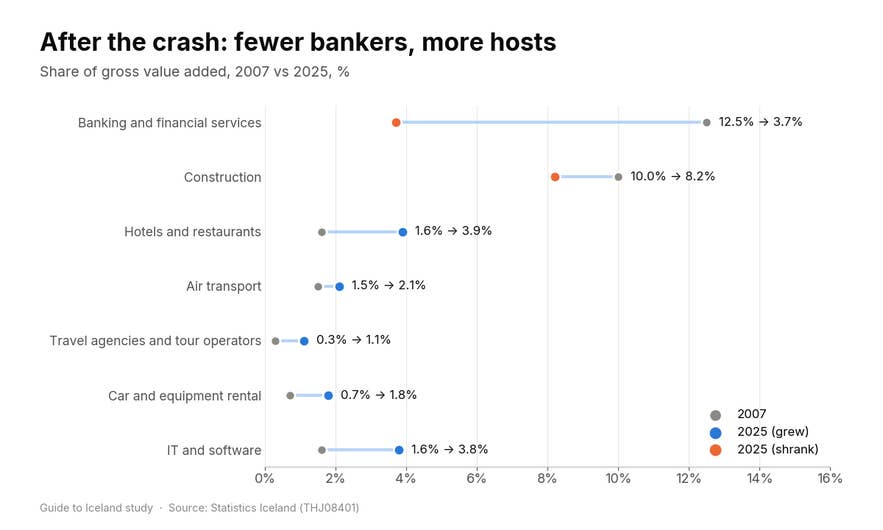
Look at what grew. Car and equipment rental went from 0.7% to 1.8% of the economy and travel agencies and tour operators from 0.3% to 1.1%, both driven by visitors. IT and software also more than doubled, from 1.6% to 3.8%, with no help from tourism at all.
What Currency Does Iceland Use?
Iceland uses its own currency, the Icelandic króna (ISK). It isn't in the euro, the EU or any currency peg, so the exchange rate floats freely and can move a long way in a year. On 28 September 2026, one euro bought about ISK 137 and one US dollar about ISK 120.
For travellers, the price of your trip in your own currency depends on the króna as much as on Icelandic prices. The króna strengthened sharply between 2013 and 2017, when a euro fell from ISK 162 to ISK 121, and weakened again during the pandemic. Our guide to the Icelandic króna covers cards, cash and exchange tips, and you'll rarely need notes at all: card payments work almost everywhere.
Why Is Inflation So High in Iceland?
A tiny, open economy with its own currency imports inflation every time the króna weakens, and Iceland's labour market is tight enough that wage deals push prices up too. Consumer prices rose 5.6% in the year to August 2026, more than twice the Central Bank's 2.5% target.
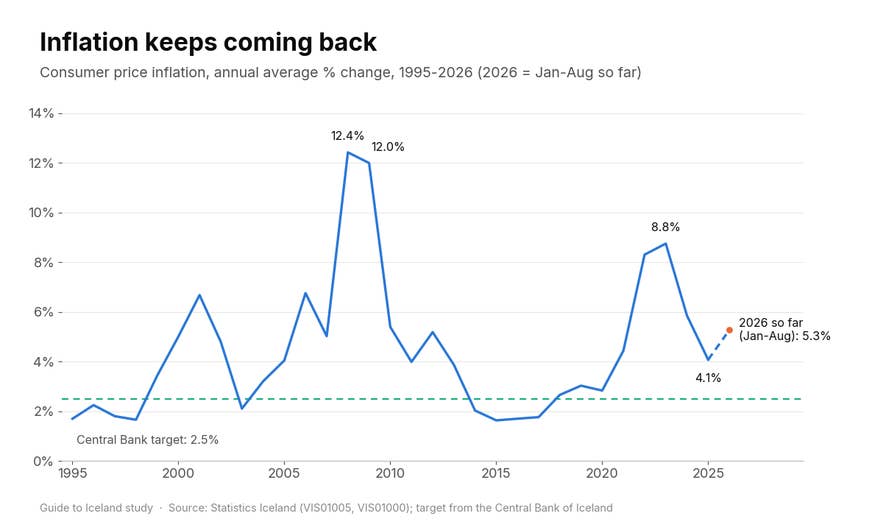
Inflation has stayed below the target in only five years since 2000. After the pandemic it climbed to 8.8% in 2023 and fell to 4.1% in 2025, but it has picked up again this year. Across the first eight months of 2026, consumer prices averaged 5.3% higher than in the same months of 2025.
Month by month, the rise is clear. The 12-month rate stayed between 3.7% and 4.6% all through 2025, then jumped from 4.5% in December to 5.2% in January 2026 and hasn't dropped below 5.1% since.
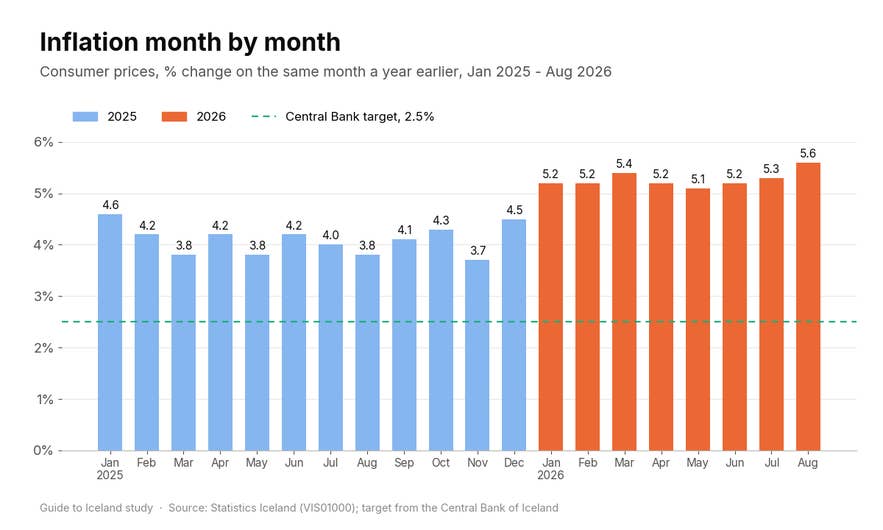
The Central Bank points to higher public levies and price rises linked to the conflict in the Middle East. It raised its policy rate to 8.0% on 19 August 2026, its third increase in a row. Mortgage holders feel that directly, and visitors feel it in menu prices that change from one summer to the next.
Why Is Iceland So Expensive?
Iceland overtook Switzerland in 2025 to become the most expensive country in Europe. Eurostat's price comparison puts the price level of consumer goods and services at 83.7% above the EU average, against 81.0% in Switzerland, 40.2% in Denmark and 38.4% in Norway.
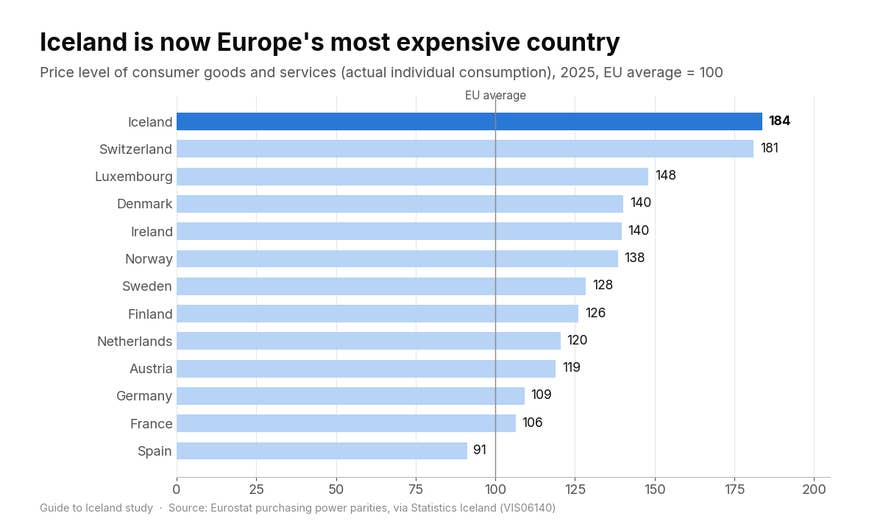
The reasons follow from everything above. High wages set the cost of every service, from a guided tour to a haircut. Most goods are imported over long distances into a market of fewer than 400,000 people, so there are few economies of scale. Strong tourism demand keeps hotels and restaurants busy, and a stronger króna in 2025 pushed prices up further for anyone paying in euros or dollars.
Some prices sting more than others. Alcohol costs almost three times the EU average, and restaurants and hotels 73% more.
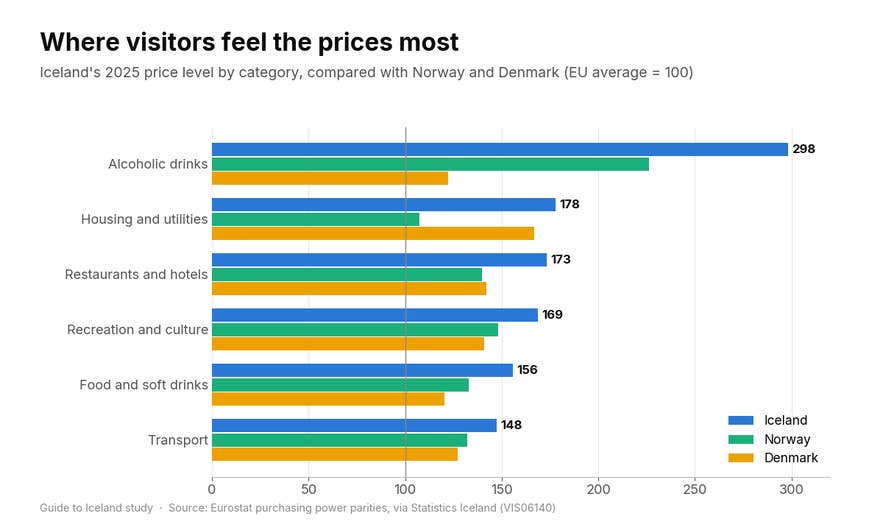
Even against its expensive Nordic neighbours, Iceland stands out. Here are the same figures side by side, with the EU average set at 100:
| Category (EU = 100) | Iceland | Norway | Denmark |
|---|---|---|---|
| All consumer goods and services | 184 | 138 | 140 |
| Alcoholic drinks | 298 | 226 | 122 |
| Housing and utilities | 178 | 108 | 167 |
| Restaurants and hotels | 173 | 140 | 142 |
| Recreation and culture | 169 | 148 | 141 |
| Food and soft drinks | 156 | 133 | 121 |
| Transport | 148 | 132 | 127 |
The practical takeaway: groceries are the cheapest way to stretch a budget. Food and soft drinks cost 56% above the EU average, well below the 73% premium on eating out. Shopping at Icelandic supermarkets, picking best-value places to eat in Reykjavík, grabbing a famous Icelandic hot dog and timing your drinks to happy hour all help. Our full guide on how expensive Iceland is breaks down costs item by item, and there's a list of the best cheap things to do in Reykjavík.
Save your splurges for what Iceland does best. A meal at one of the best restaurants in Reykjavík, a pint from the list of Iceland's best beers or a real lopapeysa wool sweater costs more than at home, but you can't get them at home. Our shopping guide and list of top souvenirs from Iceland help you pick what's worth the price, and our study of the souvenirs tourists actually buy shows what other visitors chose.
Transport is where planning pays most. A rental car in Iceland split between several travellers usually costs less than separate day tours, and small and cheap cars cut both rental and fuel costs. A campervan combined with camping in Iceland folds transport and accommodation into one price. Our breakdown of how much it costs to rent a car in Iceland shows what to budget, and it's worth reading up on driving in Iceland before you go.
If you'd rather know the full cost up front, self-drive tours bundle car and accommodation into one price, and vacation packages add guided activities on top. Our study of the cheapest month for a self-drive tour shows when those packages cost least. You can also compare accommodation in Iceland across every price range, or start with the cheapest places to stay.
Who Works in Iceland?
Almost everyone who can. Iceland's labour force participation rate was 81.4% of people aged 16 to 74 in 2025, one of the highest in the OECD, and unemployment averaged 4.3% that year before rising to 6.5% in the second quarter of 2026.
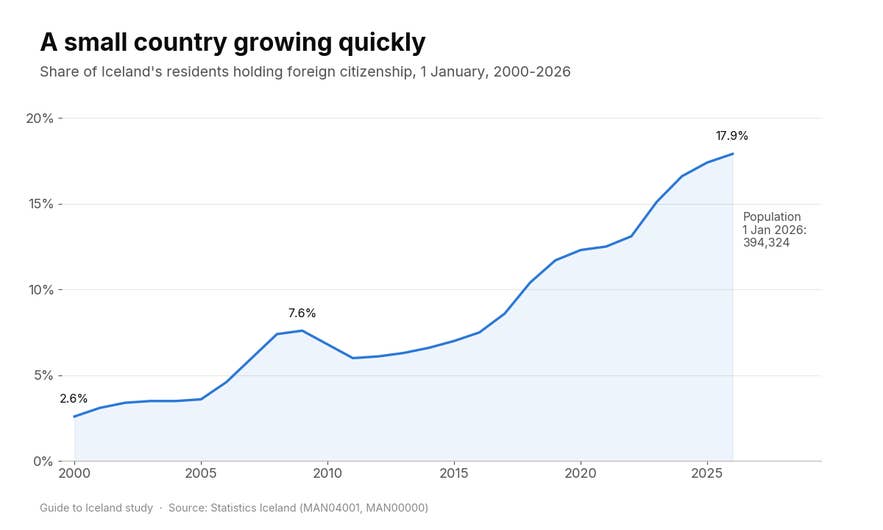
Much of that workforce came from abroad. On 1 January 2026, 70,555 residents held a foreign passport, 17.9% of the population, up from 2.6% in 2000. Polish citizens are by far the largest group, at 23,329. Our demographics of Iceland study breaks the numbers down by nationality, region, age and religion. Tourism and construction could not have grown as they did without them, and there's a good chance the person serving your breakfast or driving your tour bus moved to Iceland within the last decade.
If you're thinking of joining them, our guides on how to find a job in Iceland, how to move to Iceland and buying property in Iceland cover permits, wages and housing, and there's a separate guide to studying in Iceland. For the longer story of who Icelanders are, read where Icelanders come from and what makes an Icelander.
What Does Iceland's Economy Mean for Your Trip?
Four things matter for visitors. Budget for Europe's highest prices, especially for alcohol and eating out. Watch the króna, because a few percent either way changes the cost of the whole trip. Expect card payments everywhere and very little cash. And remember that your spending is a third of the country's export income, so the tours, guesthouses and restaurants you choose help keep rural Iceland busy through the winter.
Guide to Iceland works with local partners across the country, many of them small, family-run businesses. We're proud that the money our travellers spend supports them directly, and we work with every partner to make sure tours and rentals on our marketplace meet the highest safety standards.
How We Did This Study
All figures come from official sources, retrieved on 28 September 2026. GDP, growth, industry shares, exports, tourism satellite accounts, population, citizenship, earnings, the labour force survey, consumer prices, price levels, aquaculture and electricity use come from the Statistics Iceland PX-Web database (tables THJ01000, THJ01102, THJ08401, UTA05003, UTA06105, SAM08008, SAM02001, MAN00000, MAN04001, MAN04103, VIN02002, VIN01002, VIS01000, VIS01005, VIS06140, SJA07001, UMH40210, IDN02103 and, for 2026 unemployment, the quarterly labour force survey VIN00910). The 2025 national accounts and tourism satellite accounts are preliminary and may be revised.
International comparisons of GDP per person, GDP at purchasing power parity and government debt come from the IMF World Economic Outlook DataMapper. Price levels come from Eurostat's purchasing power parity programme (actual individual consumption) as republished by Statistics Iceland. Annual exchange rates are from Eurostat, and the policy rate from the Central Bank of Iceland. Details of the 2008 banking crisis come from the Bank for International Settlements, and the hydro, geothermal and home-heating shares from the Government of Iceland.
Industry shares are shares of gross value added. Visitor spending per head divides the balance-of-payments travel item by foreign departures from Keflavík, so it includes a little spending by cruise passengers and others who don't fly out through Keflavík and should be read as an estimate. Inflation is calculated from annual average index values; the 2026 figure compares the average index for January to August 2026 with the same months of 2025. Electricity per resident divides 2024 domestic supply by the 2024 mean population.
Keep Reading: More Guide to Iceland Studies
This study is part of our series of original research on travel in Iceland. If prices are on your mind, start with our study of the cheapest time to visit Iceland, then work out how many days you need in Iceland. For the rest of the series:
- Demographics of Iceland: population, immigration and religion
- The cheapest month for a self-drive tour in Iceland
- The souvenirs tourists actually buy in Iceland and the most recommended hot springs
- The best and worst months to visit Iceland, from 26 years of weather data
- The sunniest month in Iceland, the rainiest, the windiest and the warmest
- The tours in Iceland with the highest satisfaction rates
- Iceland's best hidden gems, ranked from 24,877 traveller comments
- How often volcanoes erupt in Iceland, a 1,155-year study
- Glacier melting rates in Iceland, a 135-year study
- The best time to visit ice caves and the safest month for ice caves
- The best time to visit the Blue Lagoon
- The best month to see the northern lights in Iceland and the regions with the clearest skies

Guide to Iceland Editorials is the shared byline for our content team. We use it on pieces several people worked on together, where no single writer owns the article, and on anything rewritten often enough that a personal byline would be misleading. We also publish our original data studies under this profile. Each study answers a question travelers ask about Iceland, using primary sources such as booking records, traveler reviews and public datasets, and every study is quality checked by human experts before it's published. Everything under this byline is researched and reviewed by people who live and work in Iceland. If you spot something out of date or want to suggest a correction, message us and it reaches the whole team.