We analyzed 26 years of Icelandic Met Office rainfall records and daily rain-day data to find the rainiest and driest months in Iceland. The rainiest month changes from coast to coast, and the wettest corner of the country gets four times the rain of the driest.
Pack a rain jacket for Iceland and you will wear it in any month. In Reykjavik, it rains on 15 to 18 days a month in every month of the year. What changes with the season is how hard it rains, not how often.
September is the rainiest month in Reykjavik and on the South Coast. It is also when the first northern lights tours of the season run. June, when tents and camper vans come into season, is the driest month nearly everywhere.
Why You Can Trust Our Content
Guide to Iceland is the most trusted travel platform in Iceland, helping millions of visitors each year. All our content is written and reviewed by local experts who are deeply familiar with Iceland. You can count on us for accurate, up-to-date, and trustworthy travel advice.
The rainfall amounts in this study come from Icelandic Met Office weather stations, which measure how much rain and snow falls each month. We used the seven stations with a complete record from 2000 to 2025.
The seven stations are Reykjavik, Keflavik, Stykkisholmur, Akureyri, Grimsstadir, Dalatangi, and Vatnsskardsholar on the South Coast near Vik. Their totals decide the rainiest and driest months and the wettest and driest places.
Two more stations fill two regions the other seven miss. Isafjordur in the Westfjords published records to 2022, and Storhofdi in the Westman Islands published to 2014. Their averages cover those shorter windows only.
The stations measure how much rain fell, and not how hard or how often it arrived. For that, we used a weather model called ERA5. It rebuilds past weather day by day from satellite and station data.
From it, we counted two kinds of day at eleven locations. A wet day brings at least 0.04 inches (1 mm) of rain. A heavy-rain day brings at least 0.4 inches (10 mm).
The eleven locations are the nine stations themselves plus Hofn and Egilsstadir. ERA5 overstates how much rain falls in Iceland, so we used it only to count days and to compare places.
Key Findings
-
Rain in Iceland is frequent, not heavy. Reykjavik gets 35 inches (893 mm) of rain a year, spread over 15 to 18 wet days a month. Even June, the driest month, has about 15 wet days. The wet months differ from the dry ones mainly in heavy-rain days. A Reykjavik September brings about 5 of them, and a June brings about 2.
-
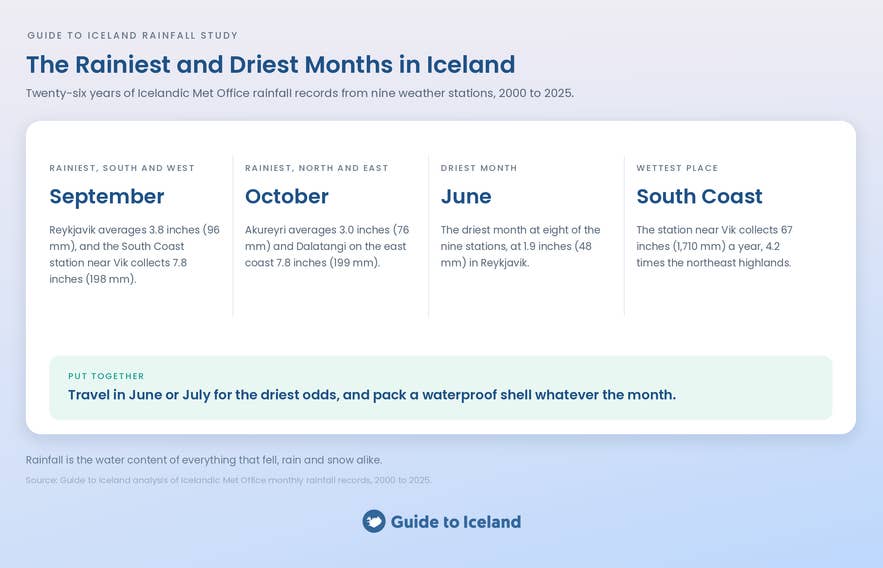
September is the rainiest month in South and West Iceland. Reykjavik averaged 3.8 inches (96 mm) of rain in September from 2000 to 2025. Keflavik averaged 5.0 inches (126 mm), and the South Coast station near Vik collected 7.8 inches (198 mm).
-
October is the rainiest month in North and East Iceland. Akureyri averaged 3.0 inches (76 mm) in October. Isafjordur recorded 4.7 inches (119 mm), and Dalatangi on the east coast collected 7.8 inches (199 mm).
-
June is the driest month in Iceland. It is the driest month at eight of the nine stations, with 1.9 inches (48 mm) in Reykjavik and 0.9 inches (23 mm) in Akureyri. The exception is Grimsstadir in the Highlands, where April is driest.
-
The South Coast is the wettest place in Iceland, and the Northeast Highlands are the driest. The station near Vik averaged 67 inches (1,710 mm) a year and about 114 heavy-rain days. Grimsstadir averaged 16 inches (410 mm) and about 20 heavy-rain days.
-
The wettest and driest months on record were both Marches. Reykjavik recorded 8.2 inches (210 mm) in March 2022 and 0.2 inches (5 mm) in March 2023, one year apart.
Cite This Study
The charts and data in this study are free to use under CC BY 4.0. Credit Guide to Iceland and link to this page. Every chart has an Embed button underneath it with ready-to-paste code.
September Is the Rainiest Month in South and West Iceland
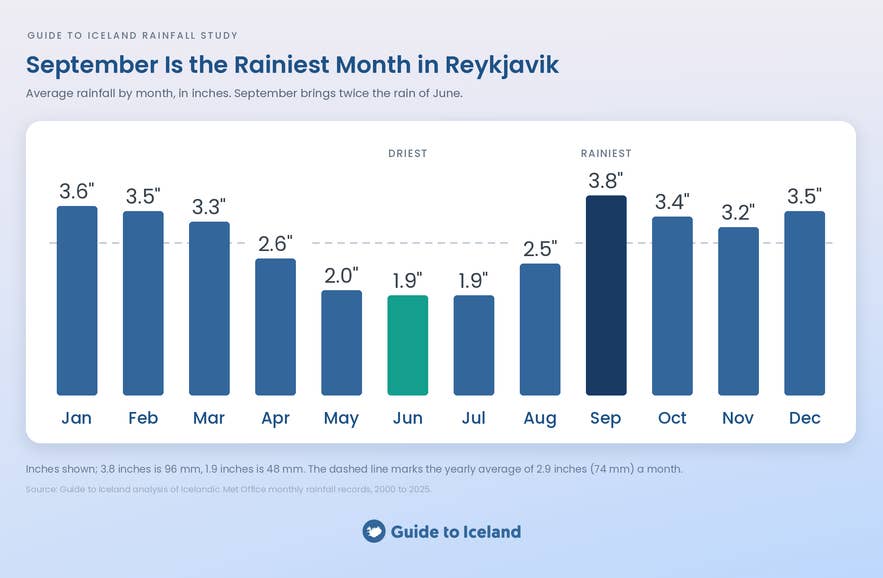
September is the rainiest month in Reykjavik. The city averaged 3.8 inches (96 mm) of rain in September between 2000 and 2025. January came a close second at 3.6 inches (92 mm), and December came third at 3.5 inches (90 mm).
September also leads along the whole south and west coast. Keflavik averaged 5.0 inches (126 mm) in September, and Stykkisholmur on the Snaefellsnes Peninsula recorded 3.6 inches (90 mm).
The wettest September figures come from the far south. The South Coast station near Vik collected 7.8 inches (198 mm). Storhofdi in the Westman Islands saw 8.2 inches (208 mm) in the years it reported. Both are more than double Reykjavik's September.
The table below shows average rainfall in Reykjavik for every month of the year, based on the 26 years from 2000 to 2025.
| Month | Rainfall (inches) | Rainfall (mm) |
|---|---|---|
| January | 3.6 | 92 |
| February | 3.5 | 89 |
| March | 3.3 | 83 |
| April | 2.6 | 65 |
| May | 2.0 | 51 |
| June | 1.9 | 48 |
| July | 1.9 | 49 |
| August | 2.5 | 62 |
| September | 3.8 | 96 |
| October | 3.4 | 87 |
| November | 3.2 | 80 |
| December | 3.5 | 90 |
Reykjavik's wet season runs from September to March. Every one of those seven months averages at least 3.2 inches (80 mm). The three driest months (May, June, and July) each average less than 2.1 inches (52 mm).
September is Reykjavik's rainiest month by a small margin, and not in every year. It was the wettest month in 6 of the 26 years, and January was the wettest in another 6. Autumn and winter in Reykjavik are close to equally wet.
September pays for its rain with the fall colors, which peak in the same weeks.
October Is the Rainiest Month in North and East Iceland
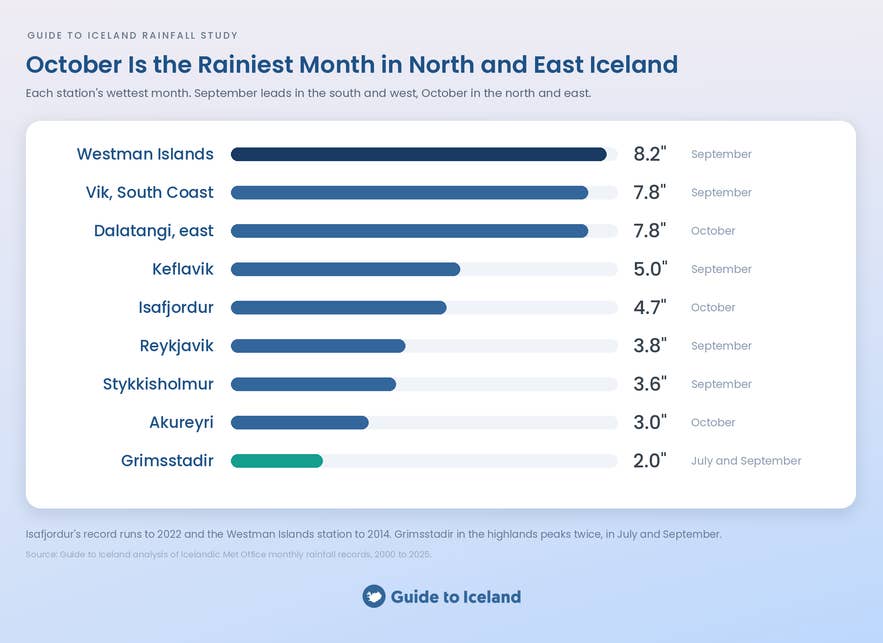
October is the rainiest month in North and East Iceland, one month after the south. Akureyri averaged 3.0 inches (76 mm) of rain in October between 2000 and 2025. Isafjordur in the Westfjords collected 4.7 inches (119 mm), and Dalatangi on the east coast recorded 7.8 inches (199 mm).
October's lead is clearer in the north than September's is in the south. October was Akureyri's wettest month in 8 of the 26 years. December took the title in 6 years and November in 5.
The north is also far drier than the south in every season. Akureyri's wettest month brings about as much rain as an average month in Reykjavik, where the year averages 2.9 inches (74 mm) a month.
Akureyri's whole autumn, September to November, totals 8.1 inches (206 mm). Reykjavik's autumn totals 10.4 inches (264 mm).
The Highlands follow a pattern of their own. At Grimsstadir, the wettest months are July and September, each with 2.0 inches (51 mm), and the driest is April.
From December to March, Grimsstadir gets only about 1 inch (25 mm) a month. With average temperatures below freezing, most of that falls as snow.
The rain-day counts from the ERA5 weather model agree on the month. October has the most wet days of the year at Akureyri, Dalatangi, and Grimsstadir. At Isafjordur and Egilsstadir, October comes within a day of the highest count.
For a traveler, the one-month shift matters most in September. Road trips and tours across Iceland in September meet the wettest month of the year in Reykjavik and on the South Coast. They reach the north before the northern rains peak.
June Is the Driest Month in Iceland
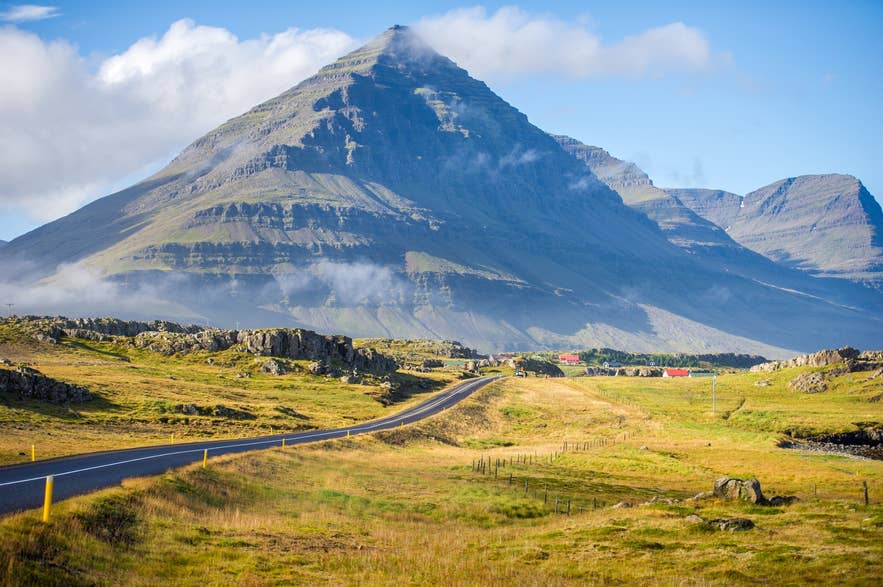 June is the driest month in Iceland at nearly every station in the study. It had the lowest average rainfall at eight of the nine weather stations between 2000 and 2025. Reykjavik averaged 1.9 inches (48 mm) in June, half of its September total.
The June figures are low everywhere. Akureyri recorded 0.9 inches (23 mm), Isafjordur collected 1.1 inches (27 mm), and Stykkisholmur measured 1.3 inches (34 mm). Even the South Coast station near Vik, the wettest in the study, fell to 3.4 inches (87 mm).
The dry spell is short. May and July sit close to June at most stations. Those three months are the only stretch of the year when Reykjavik averages less than 2.1 inches (52 mm) of rain a month. By August, the totals are climbing again.
The gap between June and September is widest in the Westfjords. Isafjordur gets nearly four times as much rain in September as in June. In Reykjavik, the ratio is two to one, and at Dalatangi in the east it falls under two to one.
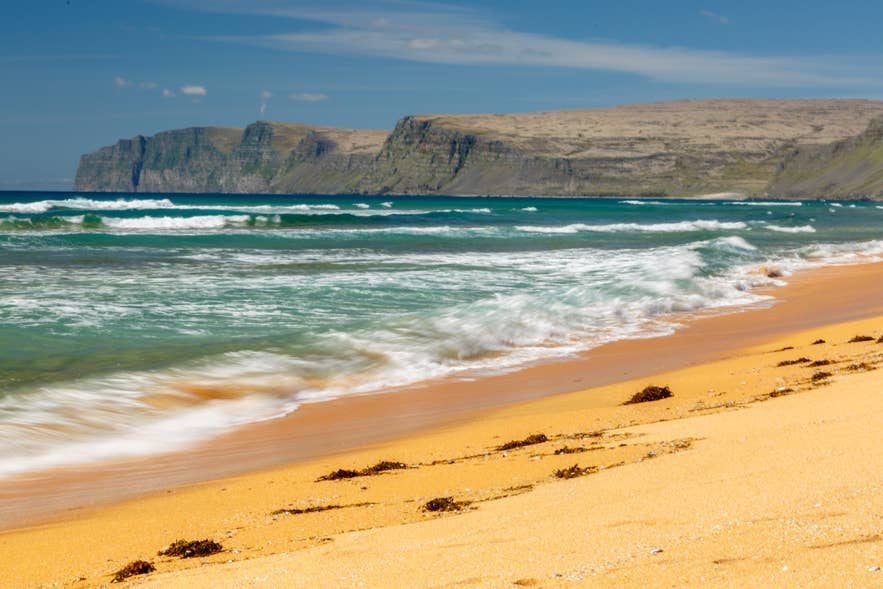 June's title is a matter of averages rather than a rule. It was Reykjavik's driest month in 7 of the 26 years, more than any other month. May, March, July, and October each took the title in three or more years. A dry June is likely and not guaranteed.
June has turned wetter since 2021, according to our study of Iceland's best and worst months to visit. Every June from 2021 to 2025 brought more rain than the 2000 to 2020 average. July has ranked as the best month for weather in those five years, so pack a rain shell for a June trip.
The wettest June in Reykjavik, in 2014, brought 4.6 inches (116 mm), more than an average September. The driest, in 2008, had 0.5 inches (13 mm).
The Highlands are the exception to June. At Grimsstadir, April is the driest month with 0.8 inches (20 mm), and June is wetter than May. The dry season there is spring, before the summer rains that peak in July.
For travelers, June combines the least rain with the most daylight. June is the one month the whole country is at its driest at once. Our study of the sunniest month in Iceland puts the north at its brightest in the same weeks. That makes June the strongest month for Ring Road tours, which pass through every region.
Rain in Iceland Falls Often but Lightly
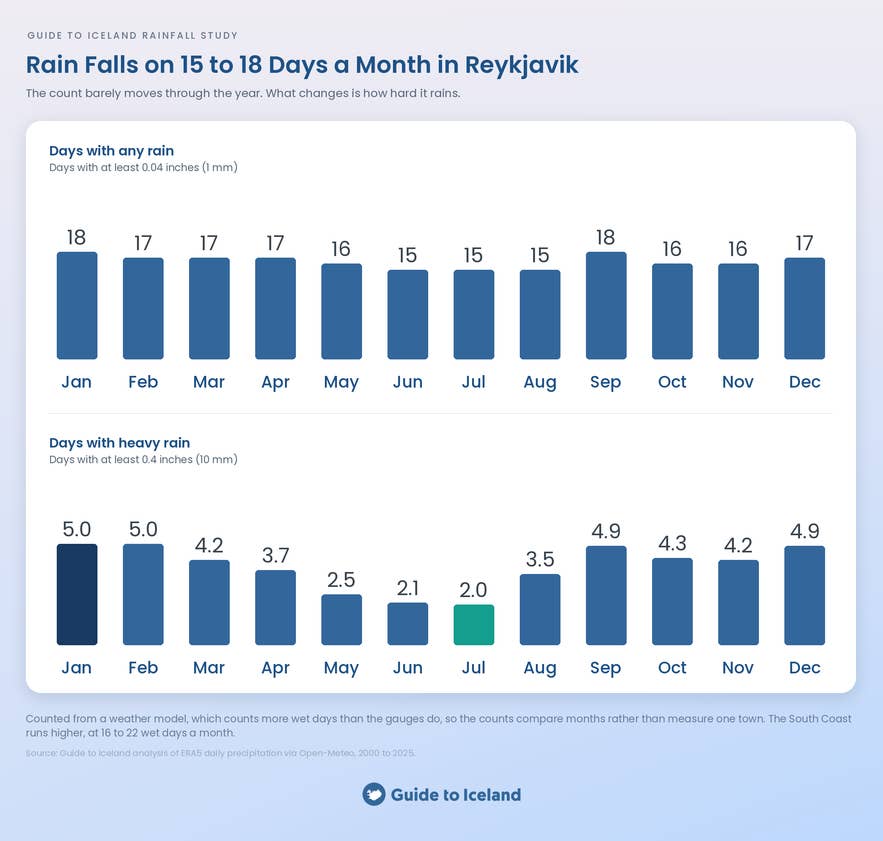
Rain in Iceland arrives often and in small amounts. Reykjavik has about 198 wet days a year, or 15 to 18 a month. That is rain on more than half the days of the year, in every season.
The number of wet days barely changes through the year. Reykjavik's wettest month for days, January, has 18 wet days. Its driest, June, has 15.
Locals dress in layers with a waterproof shell, and carrying an umbrella counts among the things not to do in Iceland. An umbrella does not survive the wind measured in our study of the windiest and least windy months in Iceland.
Heavy rain is where the seasons part. Reykjavik averages about 5 heavy-rain days in each of January and September, and it drops to 2 of them in June and July. A heavy-rain day brings at least 0.4 inches (10 mm), enough to soak through a jacket that is not waterproof.
The South Coast runs higher on both counts. Vik sees 16 to 22 wet days in every month, and it counts 235 wet days in a year, the most of the eleven locations. It also has about 114 heavy-rain days a year. Winter brings 12 or 13 of them a month, and June and July bring 5 or 6.
The Westfjords have the biggest seasonal swing in wet days. Isafjordur drops from 21 wet days in January to 11 in June, a swing of 10 days. No other location moves that far. Its June is the driest month for days anywhere in Iceland.
The Highlands are the steadiest and the lightest. Grimsstadir has 12 to 16 wet days a month and about 169 in a year. It records only about 20 heavy-rain days. Most of its rain comes in small amounts on many days.
For a traveler, the counts mean that a rain-free week is unlikely in any month, anywhere in Iceland. The realistic aim is a trip with few heavy-rain days, and June and July give the best odds of that in every region. A waterproof shell does the rest, and our guide on what to wear in Iceland covers the layers under it.
The South Coast Is the Wettest Place in Iceland
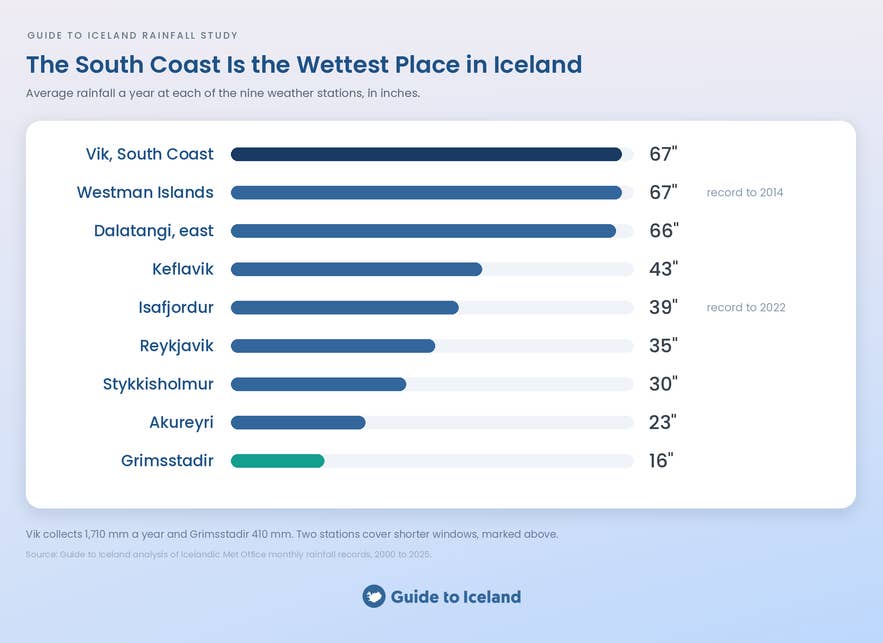
The South Coast is the wettest place in Iceland by a margin of more than four to one. The station near Vik averaged 67 inches (1,710 mm) of rain a year between 2000 and 2025.
Storhofdi in the Westman Islands collected 67 inches (1,695 mm) a year in the years it reported. Dalatangi on the east coast recorded 66 inches (1,669 mm).
The driest place is the Northeast Highlands. Grimsstadir averaged 16 inches (410 mm) a year. The wettest station collects 4.2 times as much rain in a year as the driest.
The rest of the country sits between the two. Keflavik gets 43 inches (1,088 mm) a year, and Isafjordur collects 39 inches (996 mm). Reykjavik receives 35 inches (893 mm), Stykkisholmur records 30 inches (760 mm), and Akureyri measures 23 inches (591 mm).
The north-to-south split holds in every month, not only on the yearly total. Akureyri gets less rain than Reykjavik in all twelve months. A traveler heading from the South Coast to the north in any month drives toward drier weather.
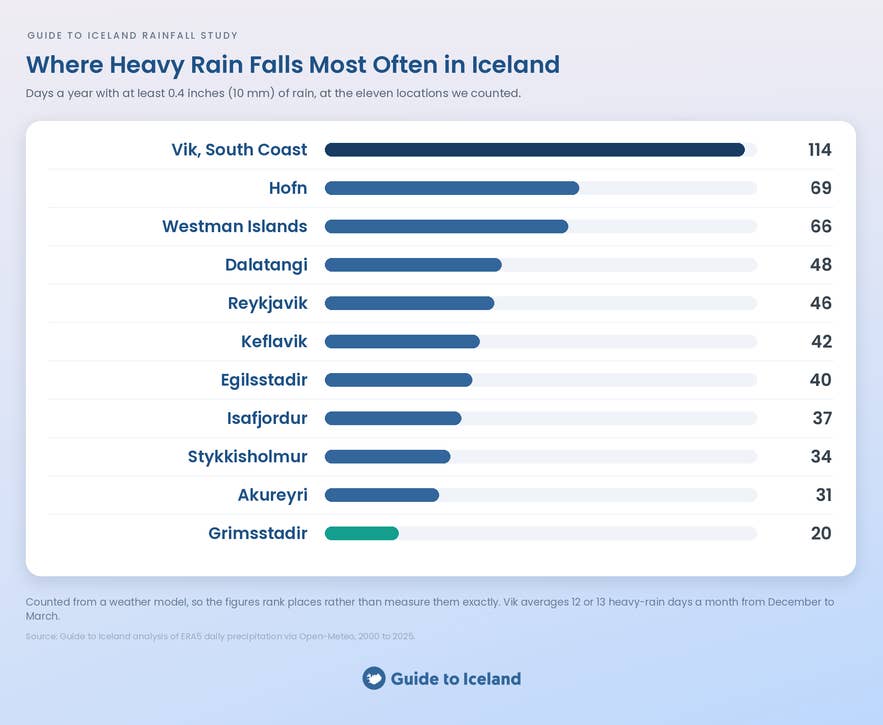
Heavy-rain days rank the eleven locations in the same order as the yearly totals. Vik has about 114 heavy-rain days a year, Hofn in the southeast counts about 69 days, and the Westman Islands count about 66 days.
Dalatangi, Reykjavik, and Keflavik fall between 42 and 48 days. Akureyri counts about 31 days a year, and Grimsstadir counts about 20, the fewest of the eleven.
The likely reason for the gap is the direction Iceland's weather comes from. Most of Iceland's rain arrives on southerly winds off the Atlantic. The South Coast and the glaciers behind it take the first and heaviest fall. The air that crosses the Highlands to the north has already lost much of its water.
The wettest stretch of coast is also the one most visitors drive. Reynisfjara Black Sand Beach and Dyrholaey Peninsula sit beside the Vik station, and Skogafoss and Seljalandsfoss waterfalls lie along the same coast.
South Coast tours run through the wettest ground in this study. That is worth knowing when weighing the day trip options from Reykjavik. It is also a reason to dress for rain rather than to skip the coast.
Planning Your Iceland Trip Around the Rain
Three trip decisions depend on the rainfall data. They are the month you travel, the coast you spend it on, and whether you head north when the south is wet.
June and July Give the Best Odds of a Dry Week in Iceland
 June and July give the best odds of a dry week in every region of the country. Reykjavik averages 1.9 inches (48 mm) in each month and only 2 heavy-rain days. Even the South Coast drops to 5 or 6 heavy-rain days a month, less than half its winter count.
June and July are when camping in Iceland and camper van rentals are least likely to be rained out. The long hiking trails in Iceland open in the same weeks. The odds of a dry day on them are the best of the year.
A dry week is still a matter of odds. June brought Reykjavik 4.6 inches (116 mm) in 2014, more than an average September. Book the month for its odds and keep a waterproof shell for the rest.
A South Coast Trip in Iceland Needs Waterproofs in Every Month
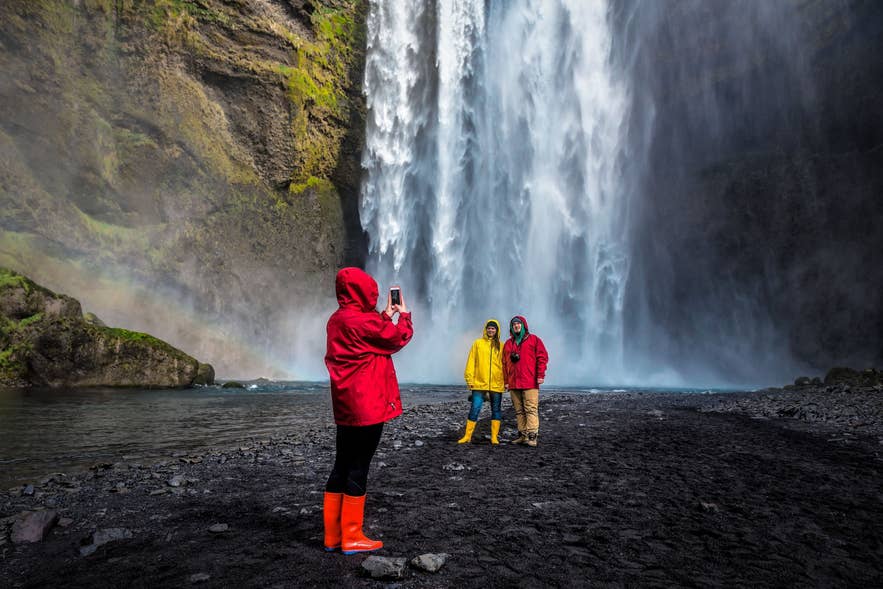 The South Coast asks for waterproofs even in its driest weeks. The station near Vik records 16 to 22 wet days a month and about 114 heavy-rain days a year, the most of the eleven locations. Its driest month, June, still brings 3.4 inches (87 mm), nearly double Reykjavik's total.
The wettest coast is also the most visited one. Skogafoss, Seljalandsfoss, Reynisfjara, and Dyrholaey all lie within reach of the Vik station. Spray from the waterfalls adds to whatever falls from the sky, so dress for wet at every stop.
In winter, guided South Coast tours take the rain out of the driving. Vik averages 12 or 13 heavy-rain days a month from December to March, and on those days the guide does the driving.
On winter self-drive tours in Iceland, give the South Coast two days rather than one. A heavy-rain day then costs a stop rather than the whole coast.
North Iceland Is a Real Way Out of the Rain
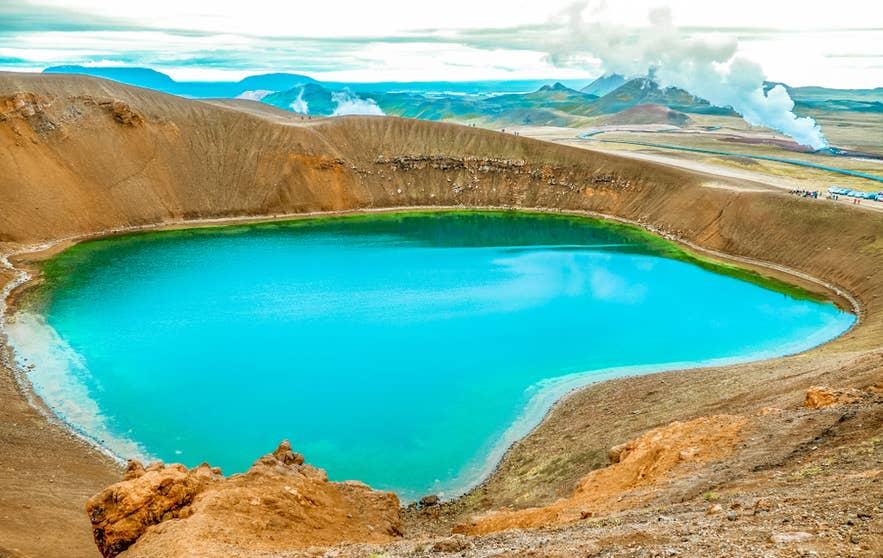 The north stays drier than the south in every month of the year. Akureyri gets less rain than Reykjavik in all twelve months. Its 23 inches (591 mm) of rain a year is a third of the South Coast total. Grimsstadir gets 16 inches (410 mm).
The north-south gap holds day by day as well as month by month. A wet forecast for the South Coast does not mean a wet day in the north.
Staying in North Iceland keeps you in the drier half of the country for more than a day trip. Ring Road tours make use of that split, because they move you between the two coasts within a week. In September, they also carry you north before the northern rains peak in October.
What This Iceland Rainfall Study Does Not Tell You
 This rainfall study ranks the months and places of Iceland by how much rain falls and how often. The limits below mark where that ranking stops being useful.
-
A 26-year average is not a forecast for your dates. March 2022 brought Reykjavik 8.2 inches (210 mm) of rain, and March 2023 brought 0.2 inches (5 mm). The same month, one year apart, produced both the wettest and the driest month of the whole study. The averages give you the odds for a month. The forecast tells you about your week.
-
The day counts come from a weather model, not a rain gauge. The monthly totals are measured at Icelandic Met Office stations. The wet-day and heavy-rain-day counts come from ERA5, which estimates conditions across grid cells several miles wide. In Iceland, the model counts more wet days than the gauges do. The counts are therefore used to compare months and places, never as exact figures for one town.
-
Two of the nine stations stop before 2025. Isafjordur's published record ends in 2022 and Storhofdi's in 2014. Their averages describe those shorter windows, and both stations are left out of any count that needs the full 26 years.
-
Rainfall in this study includes snow. The Met Office measures the water in whatever falls, so a winter total in the north or the Highlands is largely melted snow. At Grimsstadir, the 1 inch (25 mm) that falls in an average January arrives mostly as snow. The same total in Reykjavik falls mostly as rain.
-
The totals do not say how the rain arrived. A month with 3.8 inches (96 mm) could be a dozen showers or three soaking days. The heavy-rain-day counts narrow that down, but they cannot say what time of day it rained or how long it lasted.
-
Nine stations do not reach Iceland's wettest ground. The Met Office's rainfall maps put the heaviest falls on the south-facing slopes of the glaciers, where no long-running station sits. The station near Vik is the wettest in this study. It is unlikely to be the wettest place in Iceland.
-
Rain is one part of the weather. This study says nothing about wind, sunshine, or temperature. A wet day at a calm 50°F (10°C) is a different day from a wet day in a gale. Our studies of the windiest and least windy months in Iceland, the sunniest month in Iceland, and the warmest and coldest months in Iceland cover the other three.
How We Built the Iceland Rainfall Study
The rainfall study has two parts. Monthly rainfall totals come from Icelandic Met Office weather stations. Wet-day and heavy-rain-day counts come from a daily weather model, because the published station tables give monthly totals rather than daily readings.
1. Monthly Rainfall From Nine Met Office Stations
We took the monthly precipitation total from the Icelandic Met Office's published monthly tables for every month from January 2000 to December 2025. That is 312 months per station.
Seven stations cover the country's main regions. Reykjavik and Keflavik Airport sit in the southwest, Stykkisholmur stands on Snaefellsnes in the west, and Vatnsskardsholar lies on the South Coast near Vik. Akureyri covers the north, Grimsstadir covers the Northeast Highlands, and Dalatangi sits on the East Coast.
Two more stations fill the Westfjords and the Westman Islands, which the other seven miss. Isafjordur's published record runs to 2022, and Storhofdi's record ends in 2014. Their averages describe those windows and are marked as such in the charts.
Precipitation in these tables is the water content of everything that fell, rain and snow alike. The monthly averages are plain 26-year means, rounded to the nearest tenth of an inch and the nearest millimeter.
Since each month is rounded on its own, the twelve monthly figures do not sum exactly to the annual figure. That figure is calculated from the unrounded means. Statements such as "September was the wettest month in 6 of the 26 years" come from ranking the twelve months within each calendar year.
2. What We Counted as a Wet Day and a Heavy-Rain Day
A wet day is any day with at least 0.04 inches (1 mm) of precipitation. That is the threshold weather services commonly use, and it leaves out drizzle too light to measure.
A heavy-rain day is any day with at least 0.4 inches (10 mm). That is enough to soak through a jacket that is not waterproof and to leave standing water on a gravel road.
Wet days and heavy-rain days are both averaged per calendar month across the 26 years, so "5 heavy-rain days in September" means an average September, not every September.
3. Where the Day Counts Come From
Daily precipitation totals for 2000 to 2025 came from the Open-Meteo historical weather API. Open-Meteo serves the ERA5 family of reanalysis models, produced by the European Centre for Medium-Range Weather Forecasts.
ERA5 is a weather model run backward over the past decades and corrected against the observations that exist. It fills in a daily record for any point on the map, including places with no rain gauge.
We pulled the daily series for the coordinates of the nine stations above plus Hofn and Egilsstadir, eleven points in all. That set matches the locations in our sunshine study. The model overstates rainfall in Iceland and counts more wet days than the gauges do.
The day counts therefore compare months and places with each other. The station records supply the rainfall amounts themselves.
4. Units and Rounding
Rainfall is given in inches first, with millimeters in brackets, because those are the units most of our readers know. Icelandic forecasts give rain in millimeters.
Monthly totals are rounded to one decimal of an inch and to the nearest millimeter. Day counts are rounded to the nearest whole day, and to one decimal where two places run close.
5. Sources
-
Icelandic Met Office, monthly climate tables by station (Manadargildi), accessed September 2026.
-
Copernicus Climate Change Service, ERA5 hourly data on single levels, accessed through the Open-Meteo historical weather API, September 2026.
-
Guide to Iceland, The Windiest and Least Windy Months in Iceland: A 26-Year Wind Study, 2026.
-
Guide to Iceland, What Is the Sunniest Month in Iceland? A 26-Year Sunshine Study, 2026.
Conclusion
 Iceland's rain is a question of how much rather than how often, and the answer depends on which coast you stand on.
September is the rainiest month in Reykjavik and along the south and west coasts, at 3.8 inches (96 mm) in the capital. October takes over in the north and east. June is the driest month at eight of the nine stations, at 1.9 inches (48 mm) in Reykjavik.
The South Coast is the wettest place in the study, with 67 inches (1,710 mm) a year near Vik. The Northeast Highlands are the driest, with 16 inches (410 mm) at Grimsstadir. Between the two, the north stays drier in every month.
Wet days barely change with the season. Reykjavik counts 15 wet days in June and 18 wet days in January. Heavy-rain days are what the seasons move, rising from 2 a month in midsummer to 5 a month in September and January.
Three points cover most trips.
-
Book June tours or July departures for the best odds of a dry week. Reykjavik averages 1.9 inches (48 mm) in each of those months and only 2 heavy-rain days.
-
Pack waterproofs for South Coast tours in any month, and allow a spare stop. The station near Vik records 16 to 22 wet days in every month of the year.
-
Head north when the south is soaked. Day tours from Akureyri run in the driest half of the country, where the year totals 23 inches (591 mm).
A 26-year average sets the odds for your month. The Met Office forecast settles your day, and it is updated several times a day. Use this study to pick the month and the coast. Check the forecast to pack for the week.
Related reading from Guide to Iceland:
This study is part of a series Guide to Iceland runs on original data. The companion weather studies cover the windiest and least windy months, the sunniest month, and the warmest and coldest months in Iceland. A fifth study combines rain, wind, temperature, and daylight to rank the best and worst months to visit Iceland.

Guide to Iceland Editorials is the shared byline for our content team. We use it on pieces several people worked on together, where no single writer owns the article, and on anything rewritten often enough that a personal byline would be misleading. We also publish our original data studies under this profile. Each study answers a question travelers ask about Iceland, using primary sources such as booking records, traveler reviews and public datasets, and every study is quality checked by human experts before it's published. Everything under this byline is researched and reviewed by people who live and work in Iceland. If you spot something out of date or want to suggest a correction, message us and it reaches the whole team.