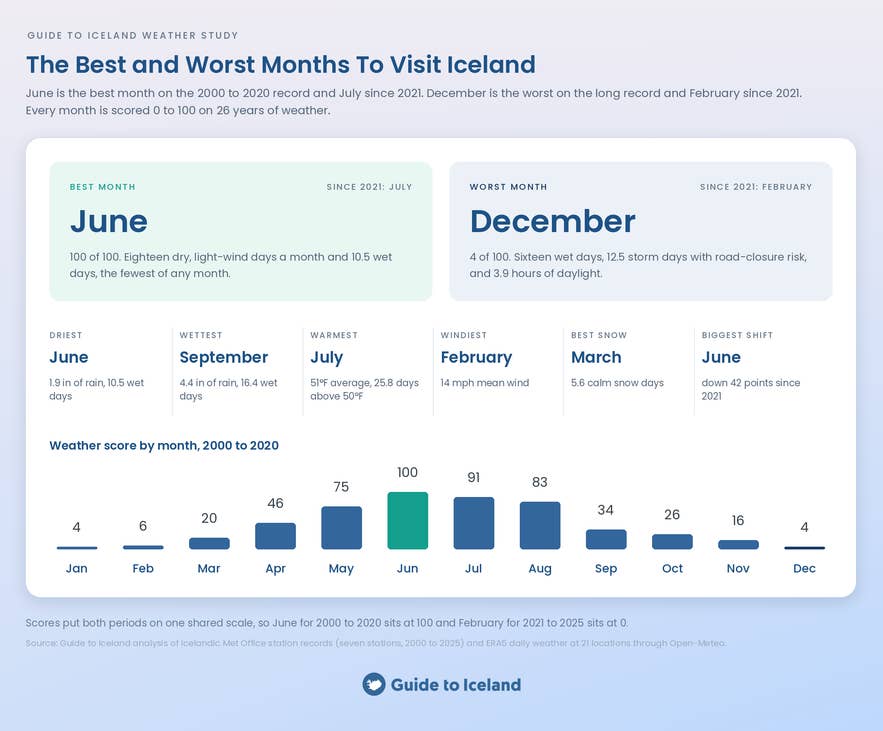
The best month to visit Iceland gives you almost twice as many dry, calm days as the worst. This study ranks all twelve months on 26 years of weather records. Use it to pick the month with the best weather odds, or to plan around a month you have already chosen.
Ask any local the best time to visit Iceland and you will get two answers: summer, obviously, and whenever you can afford it. Either is useful and impossible to test, so we went to the weather records instead.
The monthly temperatures, rainfall, wind, and cloud cover come from seven Icelandic Met Office weather stations spread across every coast. Each has a complete record from 2000 to 2025. The day counts come from ERA5, a weather model that rebuilds past weather day by day, read at 21 locations around the country.
Every month was scored twice on the same 100-point scale, once for 2000 to 2020 and once for 2021 to 2025. Dry, calm, warm, and bright days count for a month. Wet, windy, stormy, and icy days count against it.
Why You Can Trust Our Content
Guide to Iceland is the most trusted travel platform in Iceland, helping millions of visitors each year. All our content is written and reviewed by local experts who are deeply familiar with Iceland. You can count on us for accurate, up-to-date, and trustworthy travel advice.
For the best odds of dry, calm days on road trips in Iceland, we recommend July, with June and August behind. For the same roads with fewer people, May is the month to book rental cars. February or March is ideal for northern lights hunting and ice caving. Book both as guided tours, because storms close roads often in both months.
Key Findings
-
June is the best month to visit Iceland on the 26-year record. June brings 18 dry, light-wind days a month and 10.5 wet days, the fewest wet days of any month.
-
December and January are the worst months to visit Iceland, with February close behind. Both score 4 out of 100, and December takes last place on daylight, with 16.4 wet days, 12.5 storm days with road-closure risk, and 3.9 hours of daylight.
-
July has been the best month to visit Iceland since 2021. June fell to fifth place for 2021 to 2025 and lost 42 points on the 100-point scale, the largest move of any month.
-
June has gained more than four wet days a month since 2021. June’s wet days rose from 10.5 to 14.9 a month, its rainfall rose 40% from 1.9 inches (49 mm) to 2.7 inches (69 mm), and every June from 2021 to 2025 came in wetter than the 2000 to 2020 average.
-
April is the most improved spring month in Iceland. April’s rainfall fell from 2.8 inches (70 mm) to 2.1 inches (54 mm) a month and its storm days from 7.1 to 4.4, which lifts April past May into third place for 2021 to 2025.
-
December improved more than any other month since 2021. December gained 25 points, its rainfall fell by a third, and it now counts 13.3 dry, light-wind days a month, more than any other winter month.
-
Storm days outnumber calm snow days in Iceland by two to one. Iceland averages about 37 calm snow days a year against 79 storm days with road-closure risk, and three fifths of the storm days fall between December and March.
-
Iceland is about 1.8°F (1°C) warmer than it was from the 1960s to the 1980s, and the 2020s have the cloudiest summers on record. Summer cloud cover across the seven stations averages 6.3 on the Met Office’s 0 to 8 scale in the 2020s, against 6.0 in the 1960s.
Cite This Study
The charts and data in this study are free to use under CC BY 4.0. Credit Guide to Iceland and link to this page. Every chart has an Embed button underneath it with ready-to-paste code.
June Is the Best Month To Visit Iceland on the 26-Year Record
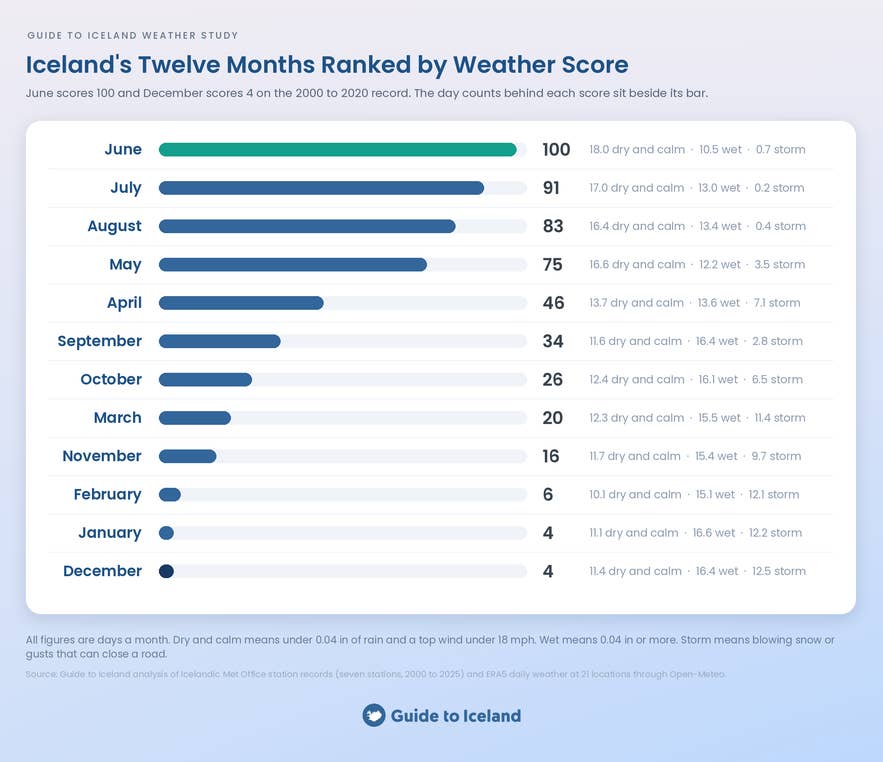
June is the best month to visit Iceland by a clear margin on the 2000 to 2020 record. It scores 100 out of 100, while July scores 91 points and August scores 83. May completes the top four on 75 points.
December and January share the bottom of the table on 4 points each, and February sits just above them on 6 points. December takes last place because it has the least daylight of the three. November, March, and October fill the rest of the bottom half.
The score rewards four kinds of day and penalizes four. The weights show which ones matter most.
| Counts for a month | Points | Counts against a month | Points |
|---|---|---|---|
| Dry days with light wind | 25 | Wet days | 20 |
| Warm dry days | 15 | Storm days that put roads at risk | 13 |
| Daylight hours | 10 | Windy days | 12 |
| Calm snow days | 10 | Days that thaw and refreeze | 5 |
The gap between the top four months and the bottom four is wide. In June, six days in ten are dry with light wind. In February, fewer than four days in ten are dry with light wind.
A week in June gives a traveler about four usable outdoor days. A week in February gives about two and a half. The difference over a ten-day trip is close to a full weekend of lost driving and hiking.
That lost weekend is not a reason to skip winter. December, January, and February bring the northern lights and the ice caves, and January and November are two of the three cheapest months to visit Iceland.
A low weather score means a trip that needs more planning and a backup for its driving days. Many of the best winter trips in Iceland are built exactly that way.
July Has Been the Best Month To Visit Iceland Since 2021
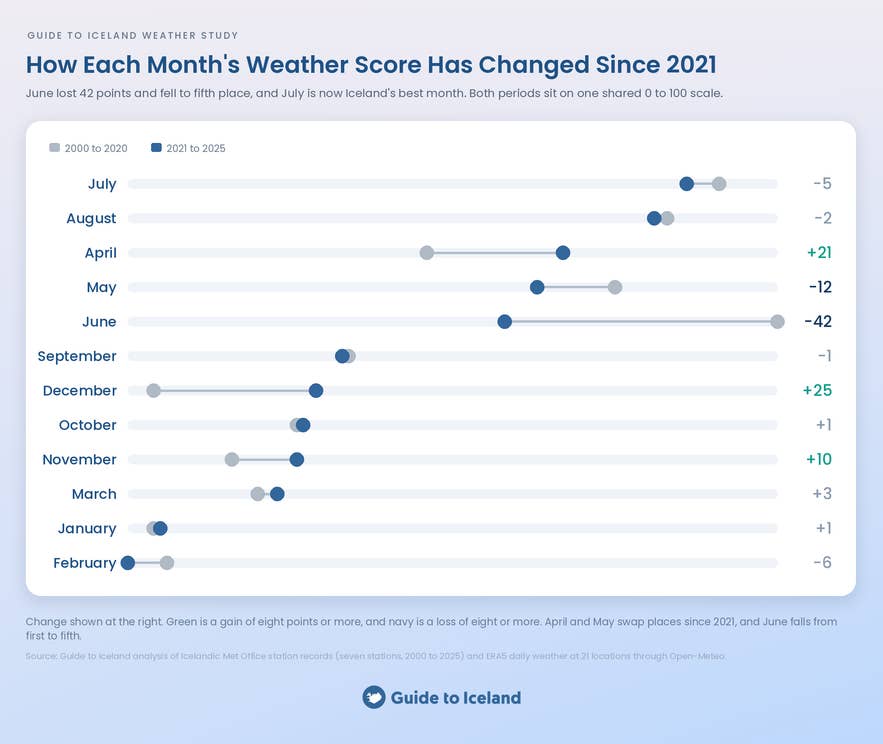
July has been the best month to visit Iceland in the five years since 2021, scoring 86 out of 100. August follows on 81 points. June, the leader on the long record, has fallen to fifth place on 58 points.
June’s fall is the largest move of any month, at 42 points. Its wet days rose from 10.5 to 14.9 a month, and its dry, light-wind days fell from 18 to 13. Its rainfall rose 40%, from 1.9 inches (49 mm) to 2.7 inches (69 mm) a month.
June’s change is consistent rather than a run of bad luck. Every June from 2021 to 2025 came in wetter than the 2000 to 2020 average, five years out of five. June also cooled, from 48.4°F (9.1°C) to 47.5°F (8.6°C). Its cloud cover rose from 6.0 to 6.4 on the Met Office’s 0 to 8 scale.
Sunshine tells the same story about June. Reykjavik’s June sunshine fell from 190 hours to 171 hours, and Akureyri’s fell from 196 hours to 179 hours. Our study of the sunniest month in Iceland looks at what that means for summer trips.
July and August went the other way from June. July warmed from 51.4°F (10.8°C) to 52.0°F (11.1°C), and August warmed from 50.7°F (10.4°C) to 51.4°F (10.8°C). Both kept their good days, the days that are dry, calm, and above 54°F (12°C). For 2021 to 2025, July delivers 10.4 good days a month and August delivers 10.3, while June delivers 5.0.
Three months improved since 2021. December gained 25 points, April gained 21 points, and November gained 10 points, mostly on fewer storm days and less rain.
February took December’s place as the worst month, scoring 0 on the shared scale. Its wet days rose from 15.1 to 16.1 a month, and its windy days rose from 5.1 to 6.0. It is the one winter month that got harder on every measure.
For a summer trip, the change that matters most is June's. A traveler who chose to visit Iceland in June ten years ago picked the safest month in the record. The same choice today buys the fifth-best month. July tours in Iceland give better odds of a dry, calm week, and August departures come close behind.
December Is the Worst Month To Visit Iceland, Judged on Wind, Ice, and Daylight
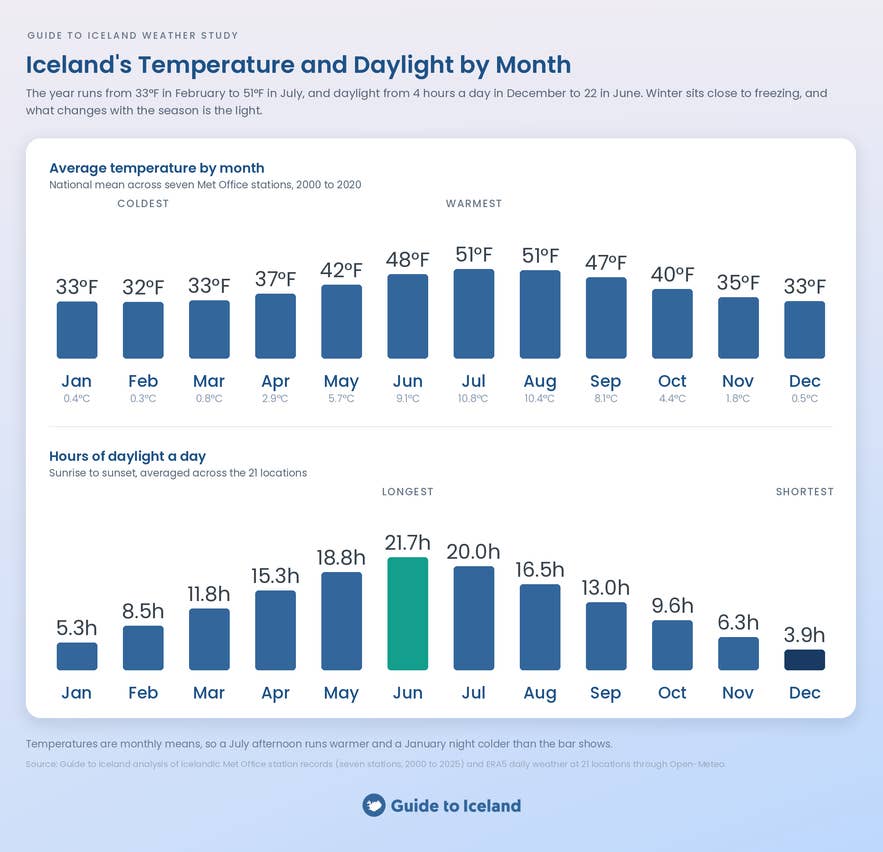
December is the worst month to visit Iceland on the long record, and cold has almost nothing to do with it. December averages 32.9°F (0.5°C), January averages 32.7°F (0.4°C), and February averages 32.5°F (0.3°C). Daily highs in all three months sit near 37°F (3°C).
Iceland’s whole year runs from 32.5°F (0.3°C) in February to 51.4°F (10.8°C) in July, according to our study of the warmest and coldest months in Iceland. That spread is about 19°F (10.5°C). Three other things make winter hard.
-
Daylight. December gives 3.9 hours of daylight a day, January gives 5.3 hours, and February gives 8.5 hours. June gives 21.7 hours, and the gap explains more about Iceland's seasons than any temperature reading.
-
Storms. December brings 12.5 storm days with road-closure risk a month, January brings 12.2, and February brings 12.1. In each of those months, roughly two days in five carry weather that can shut a stretch of road.
-
Ice. On a freeze-thaw day, the temperature climbs above freezing in the afternoon and drops below it overnight, which turns sidewalks and parking lots to sheet ice. December counts 10.6 freeze-thaw days a month, January counts 10.5, and March counts 10.9, the most of any month.
 Wind runs through all three winter months. February is the windiest month in Iceland, with a mean wind of 14 mph (23 km/h) against July’s 10 mph (16 km/h). January and February each bring 5.1 windy days a month, against 0.6 windy days in June.
Rain and snow fall on more than half the days of every winter month. December counts 16.4 wet days, January counts 16.6, and February counts 15.1. The totals are close, and the winter months differ far more in storm days than in wet days.
Summer is judged on warmth, the opposite variable. Warmth is scarce enough in Iceland to decide a summer day. So the score counts good days, which are dry, calm, and above 54°F (12°C).
July has 25.8 days above 50°F (10°C) but only 6.6 days above 59°F (15°C), and 11 of its days a month qualify as good.
Winter travel in Iceland is therefore judged on ice, wind, and daylight, and summer travel on warmth. That split is why the Planning section below puts guided tours first from December to March. It is also why dressing for an Icelandic winter is about wind and ice rather than deep cold.
Storms Close Iceland’s Roads Far More Often Than Snow Does
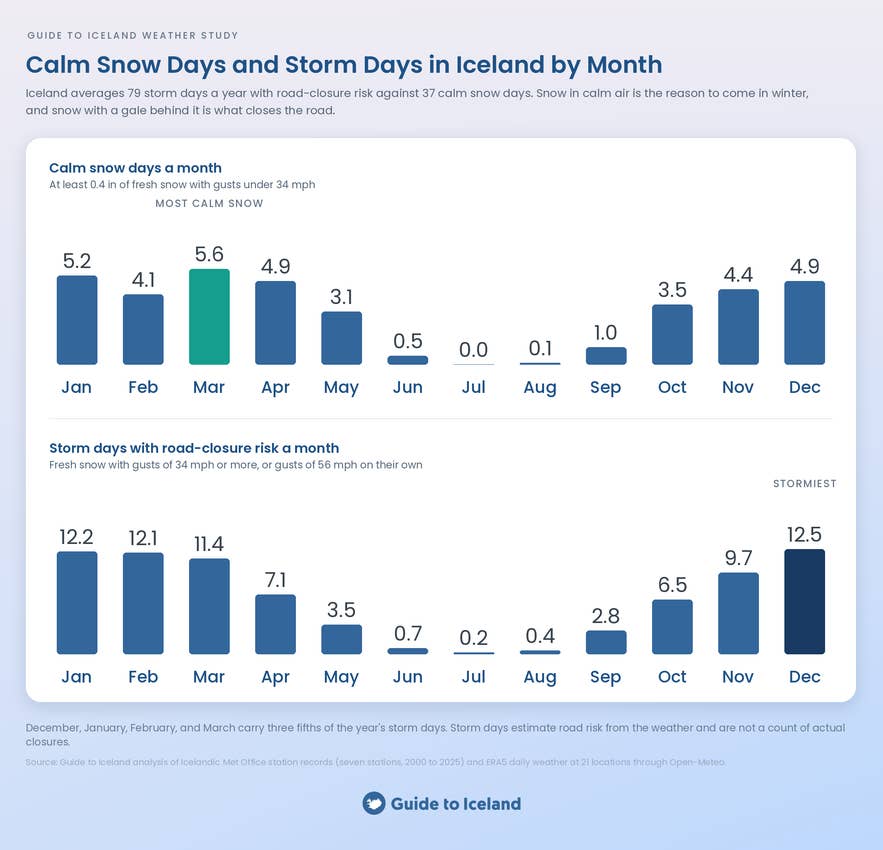
Storms close roads in Iceland about twice as often as snow alone does, so this study counts the two separately. Travelers experience them as two different things. One is the reason to come in winter, and the other is the reason a winter drive gets canceled.
A calm snow day brings at least 0.4 inches (1 cm) of fresh snow with gusts under 34 mph (54 km/h). It means a white landscape, open roads, and clear views. Iceland averages about 37 calm snow days a year.
A storm day with road risk brings fresh snow with gusts of 34 mph (54 km/h) or more. It also counts heavier snow with gusts of 27 mph (43 km/h) or more, or gusts of 56 mph (90 km/h) with no snow at all. That combination produces blowing snow, zero visibility, and closed roads. Iceland averages about 79 storm days a year.
The storm days cluster in four months. December brings 12.5 storm days a month, January brings 12.2, February brings 12.1, and March brings 11.4. Together, those four months carry three fifths of the year’s storm days.
March shows why the split between calm snow and storms matters. It has the most calm snow days of any month, at 5.6 a month, and the fourth-most storm days. It is the best month for snow in Iceland and one of the riskiest for driving at the same time.
In March, guided Ring Road tours, glacier hikes, or Golden Circle excursions work better than a solo drive. A guide decides each morning whether the road is safe, and a tour that reschedules costs far less than a day lost to a closure.
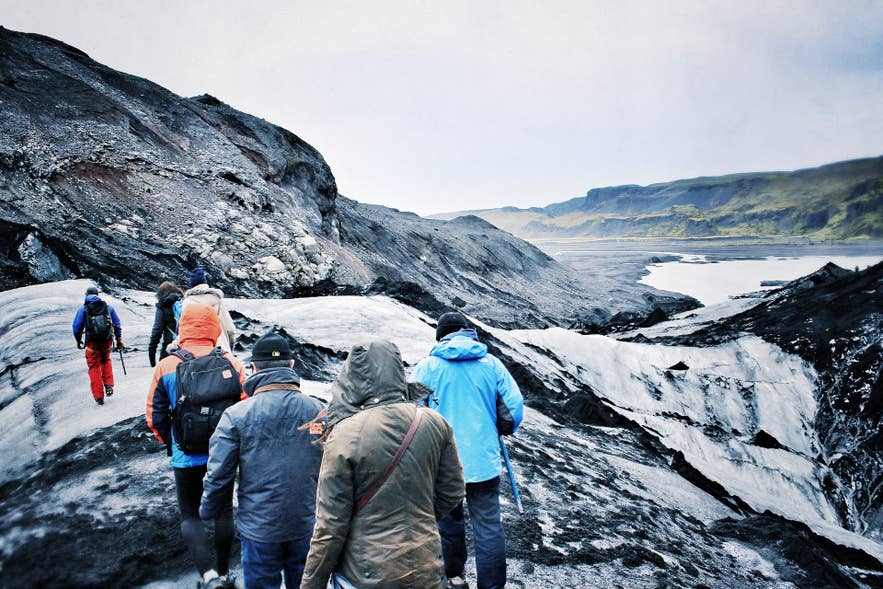
Where you drive matters as much as when. The South Coast around Vik, the village below the black-sand beaches, leads the country with about 115 storm days a year. The Westfjords follow. Bolungarvik counts about 106 storm days a year and Isafjordur counts 89, and they are the region’s two main towns.
Hveravellir, a hot-spring oasis in the central Highlands, counts about 96 storm days a year. Dalatangi, a lighthouse point on the East Coast, counts about 84. Reykjavik counts about 58 storm days a year, and Lake Myvatn in the north counts about 42, the fewest of the 21 locations.
Storm risk is the one variable our ice cave studies leave out. Both the safest month to visit ice caves and the best time to visit ice caves land on February, on cold and meltwater grounds. This study shows what February costs in wind. That cost is the reason to book an ice cave tour with a reschedule policy rather than a fixed date.
The Westfjords and the Highland passes are where an Icelandic winter bites hardest. That is why the F-roads into the Highlands stay closed until well into June, and why a Westfjords drive belongs in summer.
Rain Falls Often in Iceland, and Winter Wet Spells Run Longest
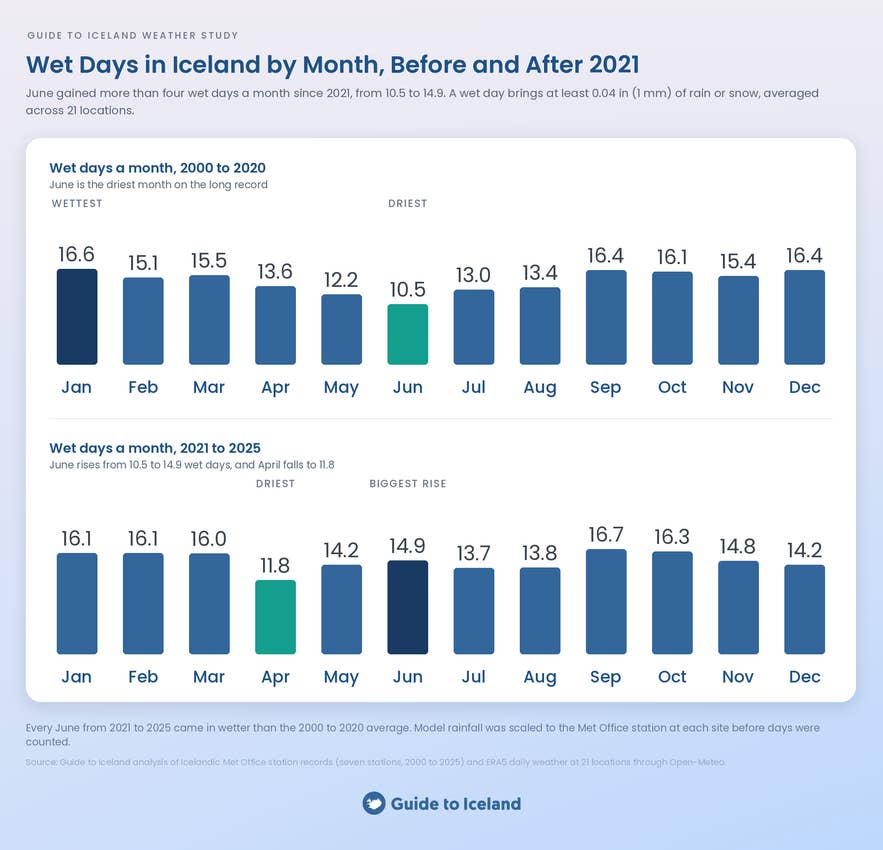
Rain or snow falls on about 174 days a year in Iceland, close to half the days in the calendar. The month-to-month spread is narrower than most visitors expect, and it is still real.
September is the wettest month by volume, with 4.4 inches (113 mm) of rain. By day count, January leads with 16.6 wet days a month, and December, September, and October all sit between 16.1 and 16.4 wet days.
June is the driest month on both measures. It brings 1.9 inches (49 mm) of rain and 10.5 wet days a month. May follows with 12.2 wet days, and July brings 13.0.
The length of a wet spell matters more for planning than the count. In June, the longest run of wet days in an average month lasts 4.1 days. The longest dry, calm streak lasts 8.1 days. In January, the wet run stretches to 7.7 days and the dry streak shrinks to 4.8 days.
Winter rain in Iceland falls no harder than summer rain. It simply arrives in longer runs, with shorter breaks between them.
Rainfall also varies more by place than by month. Vik, on the South Coast, records about 100 inches (2,528 mm) of rain a year. Grimsstadir, a Met Office weather station at a remote farm on the Ring Road east of Lake Myvatn, records 16 inches (410 mm) a year, about one sixth as much.
Akureyri, the largest town in the north, gets 23 inches (591 mm) a year, a third less than Reykjavik’s 35 inches (893 mm). A trip that is being rained out in the south usually improves by driving north. That is one reason to choose the full Ring Road route over a South Coast-only itinerary.
Iceland’s Summers Are Warmer Than They Were and Cloudier Than Ever
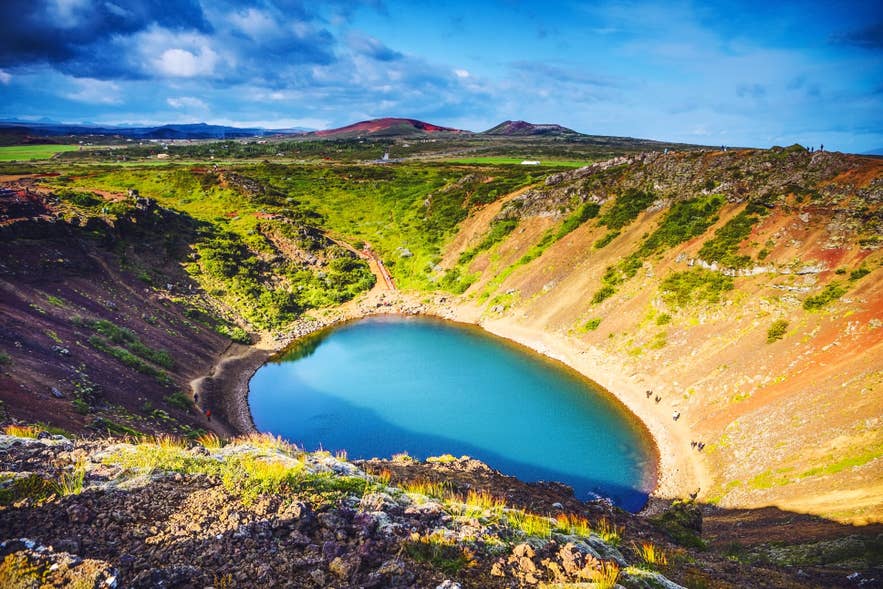
Iceland’s summers are warmer than they were in the 1960s and cloudier than at any point in the Met Office record. The seven long-running stations show a clear warming step, and the years since 2020 add a twist to it.
The national average ran at 38.3°F (3.5°C) through the 1960s, 1970s, and 1980s. It rose to 38.8°F (3.8°C) in the 1990s, and it has held between 40.1°F (4.5°C) and 40.5°F (4.7°C) since 2000. That is about 1.8°F (1°C) of warming, and most of it arrived in winter.
Iceland's winter averages moved from about 30.4°F (−0.9°C) in the 1970s and 1980s to 32.9°F (0.5°C) in the 2010s. Summer warmed too, from 48.4°F (9.1°C) in the 1960s to 50.4°F (10.2°C) in the 2000s, and it has stayed there since. Rainfall crept up over the same period, from 2.8 inches (70 mm) a month in the 1960s to 3.5 inches (88 mm) in the 2010s.
The 2020s have broken that warming pattern in two ways. Midwinter got colder again, with winter as a whole falling back to 31.5°F (−0.3°C) and giving up most of the 2010s gain. December and January now average just below freezing, which means less slush and firmer ground underfoot than a decade ago.
Summer cloud cover has risen at the same time. Across the seven stations, summer skies averaged 6.3 on the Met Office’s 0 to 8 scale in the 2020s. The 1960s averaged 6.0, and no decade between them passed 6.2. Iceland has never recorded cloudier summers, and June has clouded over the most.
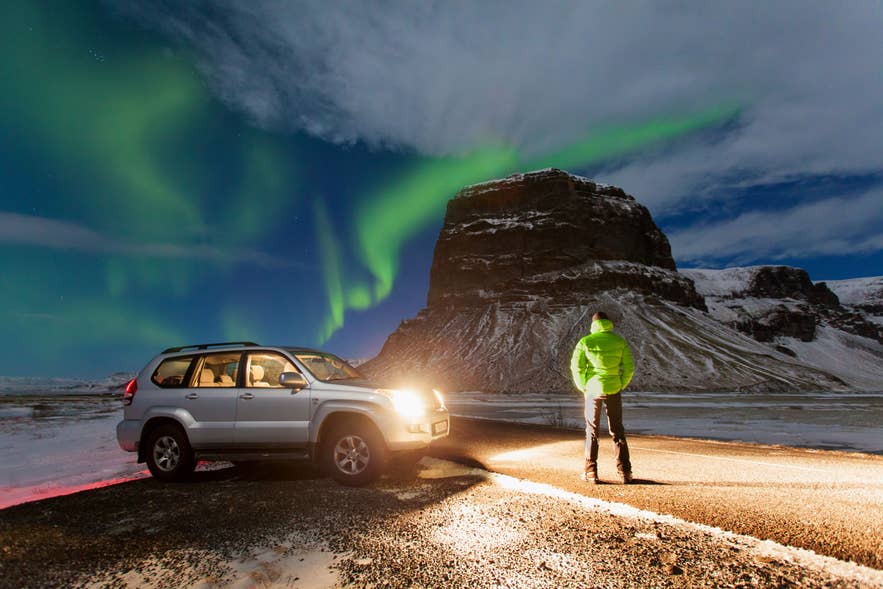
Cloud is also what decides whether the northern lights are visible on a given night. Our study of the best places to see the northern lights in Iceland ranks the regions by clear skies. Our sunshine study sets out the summer half of that picture.
For a traveler, warmer and cloudier summers pull in opposite directions. July is a little warmer than it was ten years ago, and every summer month is a little grayer. The month rankings in this study already account for both.
The Best Month Is Nearly Universal in Iceland, and the Worst Month Depends on Where You Go
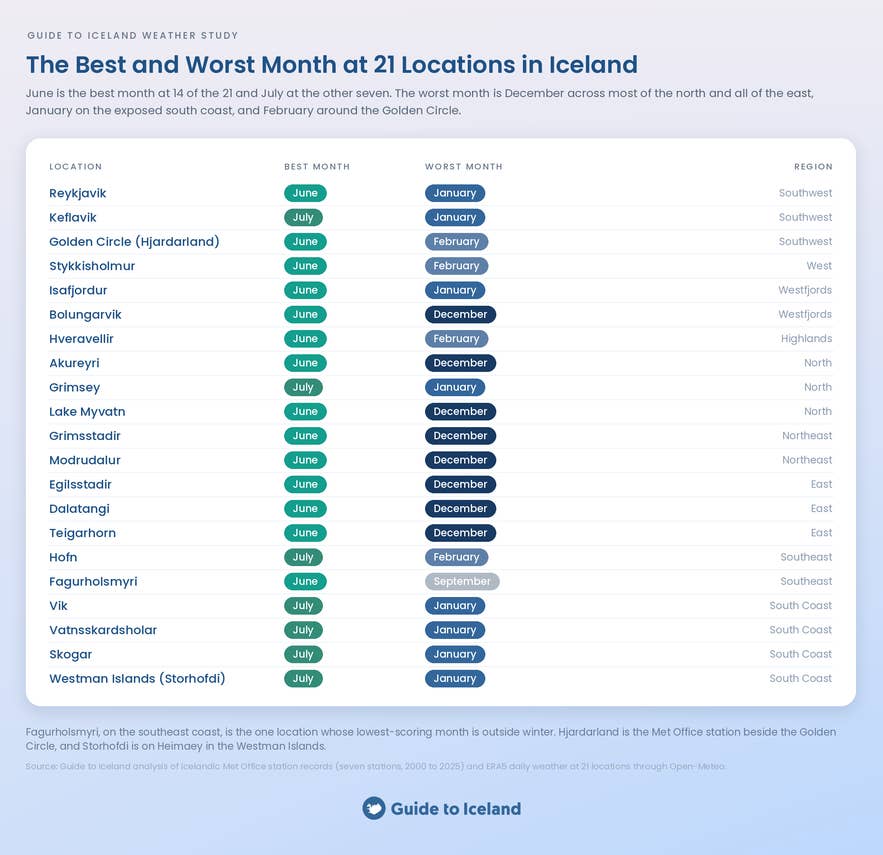
The best month to visit Iceland is nearly the same everywhere, and the worst month changes with the coast you are standing on. Iceland is small, and its weather still divides cleanly into a wet, windy south and a drier, calmer north.
June is the best month at 14 of the 21 locations in this study. They include Reykjavik, Akureyri, the Westfjords, most of the north, and all of the east.
July wins at the other seven. All of them sit on the exposed coast from Keflavik along the South Coast to Hofn, apart from Grimsey, the island off the north coast. On that coast, the wind eases a little later in the summer, and July collects the benefit.
The worst month splits three ways.
-
December is the hardest month across most of the north and all of the east. That stretch runs from Akureyri and Lake Myvatn to Egilsstadir, the main town of the east, and on to Dalatangi on the coast beyond it.
-
January is the hardest month on the exposed south and southwest coast, from Keflavik to Vik. It is also the hardest month on Grimsey Island. In the Westfjords, Isafjordur has January as its worst month and neighboring Bolungarvik has December.
-
February is the hardest month around the Golden Circle, at Stykkisholmur in the west, at Hofn in the southeast, and at Hveravellir in the Highlands.
Wind draws the sharpest line between regions. Keflavik Airport and Vatnsskardsholar lead the stations with complete records at 15.5 mph (25 km/h) of mean wind. Vatnsskardsholar is the weather station on the South Coast near Vik.
Storhofdi, on the Westman Islands off the South Coast, ran at 24.5 mph (39 km/h) until its record ends in 2013. Akureyri, at the head of a long fjord in North Iceland, sits at 6.9 mph (11 km/h). Reykjavik sits at 9.2 mph (15 km/h).
The corridor from Keflavik along the South Coast is both the most exposed part of Iceland and the stretch most visitors drive.
Rain follows the same north-south divide as wind. The north and northeast sit in the rain shadow of the Vatnajokull ice cap. They record a fraction of the South Coast’s rain, as the rainfall section above sets out. Akureyri is both drier and much calmer than Reykjavik.
A summer trip can start anywhere, and June or July will serve it. A winter trip is best planned around its region’s own worst month, with our maps of Iceland as the starting point.
How Every Month Scores in the Iceland Weather Study
Every figure below is the 2000 to 2020 average, with the change since 2021 noted where it moved the score. Temperatures are the national mean across the seven stations, and the day counts are the average across all 21 locations. For what each month feels like on the ground, our guide to Iceland’s weather month by month covers it.
January Scores 4 out of 100 in Iceland
January averages 32.7°F (0.4°C) and 3.9 inches (98 mm) of precipitation, with rain or snow falling on 16.6 days. It gives 5.3 hours of daylight a day and brings 12.2 storm days with road risk. Since 2021, it has cooled to 30.7°F (−0.7°C).
January is one of the three cheapest months to visit and the deepest part of aurora season. January tours put both to use.
February Scores 6 out of 100 in Iceland and 0 Since 2021
February averages 32.5°F (0.3°C) and 3.5 inches (89 mm) of precipitation, with 15.1 wet days and 8.5 hours of daylight. It records the highest mean wind of the year at 14 mph (23 km/h) and the fewest dry, light-wind days at 10.1 a month. For 2021 to 2025 it is the worst month in the study.
Our ice cave safety study and ice cave timing study both land on February. Book February tours with a reschedule policy.
March Scores 20 out of 100 in Iceland
March averages 33.4°F (0.8°C) and 3.3 inches (84 mm) of precipitation, with 15.5 wet days and 11.8 hours of daylight. It has the most calm snow days of any month at 5.6 and brings 11.4 storm days with road risk. Freeze-thaw days peak at 10.9 a month.
March has the widest gap between a great trip and a frustrating one. Guided March tours earn their price here more than in any other month.
April Scores 46 out of 100 in Iceland and 67 Since 2021
April averages 37.2°F (2.9°C) and 2.8 inches (70 mm) of precipitation, with 13.6 wet days and 15.3 hours of daylight. Since 2021, its rainfall has fallen to 2.1 inches (54 mm) and its wet days have fallen to 11.8. Its storm days fell from 7.1 to 4.4 a month, which lifts it to third place.
April is the most improved month in the study. April tours still run at shoulder-season prices.
May Scores 75 out of 100 in Iceland
May averages 42.3°F (5.7°C) and 2.3 inches (59 mm) of precipitation, with 12.2 wet days, 18.8 hours of daylight, and 3.5 storm days. It gives 16.6 dry, light-wind days a month, close to June’s figure, and only 2.0 good days, because warmth arrives later.
May offers June’s roads before June’s crowds arrive. May tours give the same driving with more room on it.
June Scores 100 out of 100 in Iceland and 58 Since 2021
June averages 48.4°F (9.1°C) and 1.9 inches (49 mm) of precipitation, with 10.5 wet days, 21.7 hours of daylight, and 0.7 storm days. Since 2021, it has averaged 2.7 inches (69 mm) of rain and 14.9 wet days. Every June in that period came in wetter than the long-run average.
June still ranks fifth for 2021 to 2025, well above every winter month. Book June tours with a rain jacket in the bag.
July Scores 91 out of 100 in Iceland and Leads Since 2021
July averages 51.4°F (10.8°C) and 2.7 inches (68 mm) of precipitation, with 13.0 wet days and 20.0 hours of daylight. It has the calmest wind of the year at 10 mph (16 km/h). It also has the most days above 50°F (10°C) at 25.8 and the most good days at 11.0 a month.
July is the busiest month of the year. July tours, rental cars, and accommodation in Iceland all need booking early.
August Scores 83 out of 100 in Iceland
August averages 50.7°F (10.4°C) and 3.1 inches (80 mm) of precipitation, with 13.4 wet days and 16.5 hours of daylight. It keeps almost all of July’s warmth with 10.0 good days a month, and it is the wettest of the three summer months.
August’s late nights bring the first aurora of the season. Our study of the best month to see the northern lights in Iceland rates those nights above midwinter. August tours get a taste of both seasons.
September Scores 34 out of 100 in Iceland
September averages 46.5°F (8.1°C) and 4.4 inches (113 mm) of precipitation, the most of any month, with 16.4 wet days and 13.0 hours of daylight. Storm days stay low at 2.8 a month.
September trades rain for real aurora darkness and falling prices. September tours need a rain jacket and little else.
October Scores 26 out of 100 in Iceland
October averages 39.9°F (4.4°C) and 4.3 inches (109 mm) of precipitation, with 16.1 wet days, 9.6 hours of daylight, and 6.5 storm days. Road risk starts to climb in October, with 3.5 calm snow days and 6.0 freeze-thaw days a month.
October is where the winter rules begin. October tours are the first of the season to run on aurora hours.
November Scores 16 out of 100 in Iceland and 26 Since 2021
November averages 35.2°F (1.8°C) and 4.0 inches (103 mm) of precipitation, with 15.4 wet days, 6.3 hours of daylight, and 9.7 storm days. It is one of only three months to improve since 2021, mostly because its storm days fell to 7.3 a month.
November is one of the three cheapest months to visit. On our booking data, it is also one of the cheapest and quietest months at the Blue Lagoon. November tours carry the lowest prices of the winter.
December Scores 4 out of 100 in Iceland and 29 Since 2021
December averages 32.9°F (0.5°C) and 4.2 inches (106 mm) of precipitation, with 16.4 wet days, 3.9 hours of daylight, and 12.5 storm days. Since 2021, it has gained 25 points, with rainfall down to 2.8 inches (70 mm) and dry, light-wind days up to 13.3 a month.
December ranks last on the long record, and since 2021 it has climbed further than any other month. December tours run through the longest aurora nights of the year.
Planning Your Iceland Trip Around the Weather
Planning an Iceland trip around the weather comes down to three choices. Pick the month, decide who drives, and leave room for the wind. The three sections below take them in that order.
July and June Give the Best Odds of Dry, Calm Days in Iceland
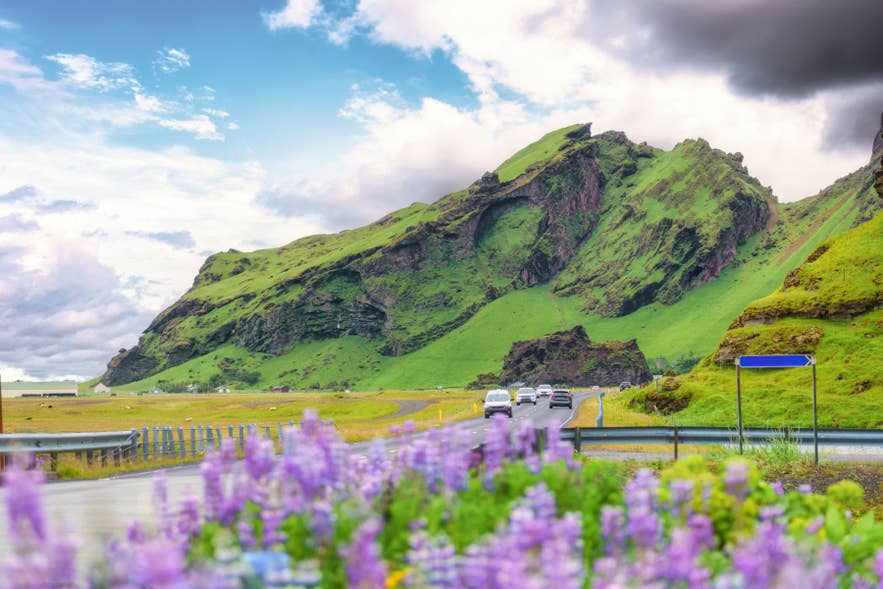
July and June give a traveler the best odds of a dry, calm day anywhere in Iceland. July brings 17 dry, light-wind days a month and 11 good days that are also warm. June brings 18 dry, light-wind days and almost no storm days.
A week in either month yields about four usable outdoor days, and the roads that matter are open. That makes them the months for self-drive tours, Highland trips, and rental cars booked well ahead.
August gives almost the same odds with darker nights, and May gives the same roads with fewer people and less warmth. Between the four, the choice comes down to crowds, prices, and how much warmth the trip needs.
A Winter Trip to Iceland Is Easier With a Guided Tour
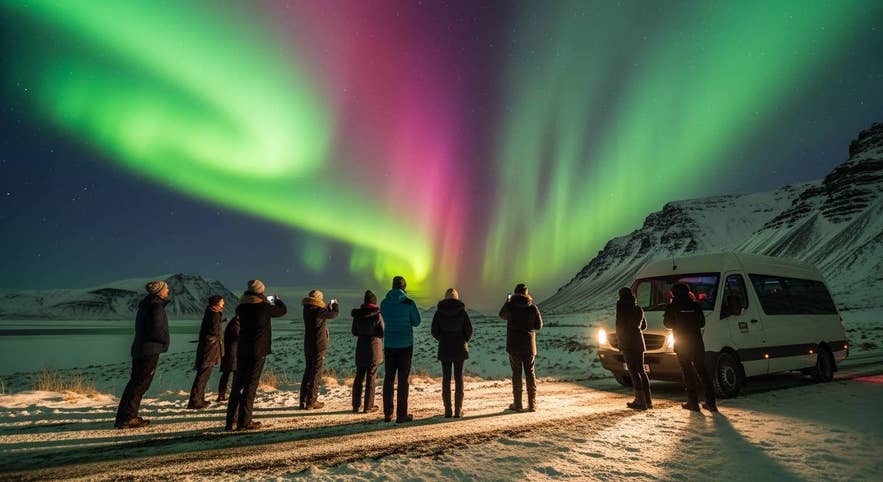
A winter trip to Iceland is easier with a guide than with a steering wheel, and the storm counts are the reason. December, January, and February each bring about 12 storm days a month with road-closure risk. Each also has around 10 freeze-thaw days that leave ice on the roads by morning.
A guide makes the call on the road each day, and a tour that reschedules absorbs a closed pass without costing the trip. That is why we recommend winter multi-day tours and northern lights tours first, especially for first-time visitors and anyone new to winter driving.
Staying in one place on a stormy day follows the same logic. Some northern lights hotels in Iceland sit outside the city lights and offer an aurora wake-up call. That turns a stormy day into a night’s viewing without a drive.
Self-Drivers Should Plan for Wind From December to March
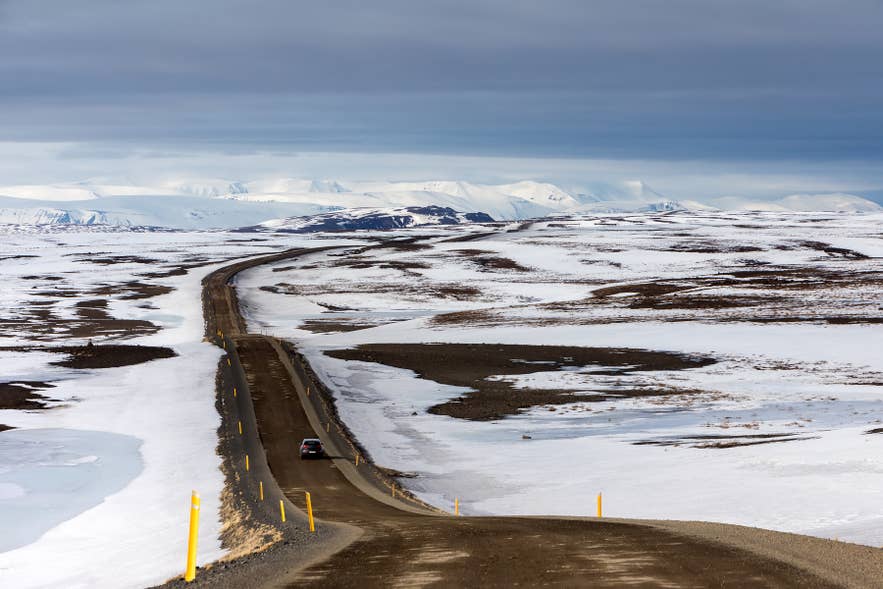
Self-drivers in Iceland should plan for wind from December to March rather than for snow. Wind is what closes the road, and the four winter months carry three fifths of the year’s storm days.
Icelandic forecasts and roadside signs give wind in meters per second, so the numbers to learn are these. Gusts of 15 m/s (34 mph) start to blow snow across the road. Gusts of 25 m/s (56 mph) can close a road with no snow at all.
Three habits protect a winter self-drive. Choose a 4x4 rental car over a compact. Check vedur.is for the forecast, umferdin.is for road conditions, and safetravel.is for alerts every morning before setting out. Build one spare day into the route, because a closed South Coast road costs a day, and a route with a buffer absorbs it.
Travelers who still want to drive themselves can book winter self-drive tours in Iceland. Those come with an itinerary built around the daylight and a local team to call when the road closes.
What This Iceland Weather Study Does Not Tell You
 This Iceland weather study ranks months on the weather alone, and six things sit outside what it can say.
Storm days are a weather-based estimate of road risk, and they are not a count of actual closures. The Road Administration closes a road on plow schedules and local judgment as much as on the weather. On some storm days the road stays open.
The weather model under-reads wind in Iceland’s narrow fjords and valleys. That is why the station records rank the places in this study and the model only ranks the months.
The score’s weights are an editorial choice. A traveler who cares more about snow or daylight would weight the months differently. The counts behind the score are in every section for anyone who wants to try.
Five years is a short window. The 2021 to 2025 figures rest on five Junes and five Decembers. The June signal holds in all five years, but it is a trend to watch rather than a settled climate.
The score has no term for crowds, prices, or darkness. Our studies of the cheapest time to visit Iceland and the best month to see the northern lights cover crowds and prices on their own data. Daylight counts for a month here, and an aurora trip does without it.
The day counts on this page differ slightly from those in our four studies on wind, sunshine, rainfall, and temperature. Those studies rank places and used eleven locations. This one ranks months and used 21. The two sets agree on every ranking and differ by less than a day on any monthly count.
How We Built the Iceland Weather Study
We built this Iceland weather study from two sources, one measured and one modeled. Every month was then scored on the same scale. The four steps below set out where each figure comes from.
1. Sources: Seven Met Office Stations and ERA5 at 21 Locations
Temperature, rainfall, cloud cover, and mean wind come from the Icelandic Met Office’s monthly station records. We used the seven stations that measured every month from 2000 to 2025.
The seven stations are Reykjavik and Keflavik Airport in the southwest, Stykkisholmur in the west, and Akureyri in the north. Grimsstadir in the northeast, Dalatangi on the East Coast, and Vatnsskardsholar on the South Coast near Vik complete the set.
Temperature and precipitation are complete for all 312 months at all seven stations. Cloud cover and wind have a handful of gaps at Akureyri, Grimsstadir, and Vatnsskardsholar. Sunshine is recorded only at Reykjavik and Akureyri, and every sunshine figure in this study comes from those two.
For the regional comparisons we also read the records for twelve more stations. They are Hofn, Lake Myvatn, Isafjordur, Vik, Storhofdi, Skogar, Teigarhorn, Fagurholsmyri, Modrudalur, Hjardarland, Bolungarvik, and Hveravellir. Several of these records end early because the station closed, and each figure from them is quoted with its own window.
The decade figures in the section on how Iceland’s weather has changed use the same seven stations back to the 1960s.
Monthly records cannot say how many days in a month were dry or stormy. For the day counts we used ERA5, a weather model that rebuilds past weather day by day from satellite and station data. We read it through Open-Meteo for every day from 2000 to 2025.
The 21 locations are the nineteen Met Office stations above, plus Egilsstadir in the east and Grimsey off the north coast. Hjardarland stands in for the Golden Circle. Between them, they cover every region of Iceland, including the Highlands and the Westfjords.
Our four studies on wind, sunshine, rainfall, and temperature rank places, so they used the eleven locations with the best station coverage. This study ranks months on a national average, so it needs the wider set.
The model’s daily rainfall at each location was scaled to match the Met Office station at the same site, month by month. Only then was any day counted as wet. Egilsstadir has no station rainfall record, so its days are counted from the model as they are. Because the months are compared on a national average, a bias at any one site largely cancels out.
The model reads wind low in Iceland’s narrow fjords and valleys. So the station records rank the places in this study, and the model ranks only the months. A model wind figure for Isafjordur or Akureyri is a national comparison, and the local station is the better guide to that town.
2. What We Counted as a Wet, Dry, Windy, Snow, Storm, and Freeze-Thaw Day
Seven kinds of day feed the score, and each one has a fixed threshold. The definitions below were applied to every day at every location, so a wet day in Reykjavik means the same as a wet day in Akureyri.
-
A wet day brings at least 0.04 inches (1 mm) of rain or snow.
-
A dry, light-wind day brings less than 0.04 inches (1 mm) and a daily maximum wind under 18 mph (29 km/h).
-
A good day is a dry, light-wind day with a daily high of at least 54°F (12°C).
-
A windy day has a daily maximum wind of at least 24 mph (39 km/h), which is Beaufort force 6.
-
A calm snow day brings at least 0.4 inches (1 cm) of fresh snow with gusts under 34 mph (54 km/h).
-
A storm day with road risk brings fresh snow with gusts of at least 34 mph (54 km/h). It also counts heavier snow of at least 1.2 inches (3 cm) with gusts of at least 27 mph (43 km/h), or gusts of at least 56 mph (90 km/h) with no snow at all.
-
A freeze-thaw day has a low below 32°F (0°C) and a high above it.
The wind thresholds were set in meters per second, the unit Icelandic forecasts and road signs use, at 8, 10.8, 12, 15, and 25 m/s. Daylight is the time between sunrise and sunset, averaged across the month at each location.
3. The Score, Units, and Rounding
Each month’s score adds four kinds of day and subtracts four, with the weights shown in the table near the top of this study. Warm dry days, daylight, and calm snow count for a month. Storm days, windy days, and freeze-thaw days count against it.
Dry, light-wind days earn the most credit and wet days carry the most blame. Those two decide, more than anything else, whether a day outdoors happens.
Every count was averaged across the 21 locations and across the years of each period, 2000 to 2020 and 2021 to 2025. The 24 month-periods were then placed on one shared scale, on which the best scores 100 and the worst scores 0. June for 2000 to 2020 sits at 100 and February for 2021 to 2025 sits at 0. The two rankings can be read side by side.
Temperatures are given in Fahrenheit with Celsius in parentheses, rainfall in inches with millimeters, and wind in miles per hour with kilometers per hour. Every figure is the 2000 to 2020 average unless the text says 2021 to 2025 or names a decade. Day counts are rounded to one decimal, scores to whole numbers, and rainfall to the nearest tenth of an inch.
Three station records end early. Storhofdi’s wind and temperature records end in April 2013 and its rainfall record in October 2014. Vik’s rainfall record ends in 2014 and Skogar’s in 2011, and figures from those stations are averages over their own windows.
4. Sources
-
Icelandic Met Office, monthly station records (vedur.is).
-
Copernicus Climate Change Service, ERA5 reanalysis, accessed through Open-Meteo.
-
Icelandic Road Administration, road conditions (umferdin.is), and SafeTravel, for the road-risk framing.
Conclusion
 The best and worst months to visit Iceland come down to a short list. Three points cover most trips.
-
July has been the best month to visit Iceland since 2021, and June still leads the 26-year record. Either gives about four usable outdoor days a week, with August close behind and May the quiet alternative.
-
December, January, and February are the hardest months, on wind, ice, and daylight rather than cold. Each brings about 12 storm days with road-closure risk, which is why a guided tour beats a rental car in winter.
-
Iceland’s weather has shifted since 2021. June has lost 42 points and fallen to fifth, April and December have improved most, and the 2020s have brought the cloudiest summers in the record.
Every count in this study is an average, and no average can promise a single day. Check the forecast the morning you set out, and let the month you chose set the odds rather than the plan.
What is the best month to visit Iceland?
What is the worst month to visit Iceland?
Is June still a good month to visit Iceland?
Which months have the most storms and road closures in Iceland?
Is it worth visiting Iceland in winter?
How many days does it rain in Iceland?
Is Iceland very windy?
What month has the most snow in Iceland?
Has Iceland’s weather changed?
Keep Reading: The Rest of Our Iceland Data Studies
This study is one of a series in which we answer travel questions with data. Explore the rest of the Guide to Iceland weather series: the sunniest month, the windiest months, the rainiest months, and the warmest and coldest months.
If the month rankings were useful, these go deeper on the trips they point you toward.
-
How many days do you need in Iceland?, from 17,664 traveler reviews. It sets the trip length that the buffer day in our Planning section fits into.
-
The cheapest month for a self-drive tour in Iceland, from 9,227 bookings. Read it against our finding that July and June give the best odds of dry, calm days on the road.
-
The study of the best whale-watching companies in Iceland compares operators. It complements the weather findings here with another factor to consider when planning a trip at sea.
-
The best time to visit Jokulsarlon and Diamond Beach, from 1,642 satellite images. The South Coast around Vik carries the country’s heaviest storm risk, and this study says when the lagoon itself is at its best.
-
Iceland’s most underrated places, from 24,877 traveler comments. Many of them sit in the north and east, where the rain is lightest and December is the month to avoid.
-
The top things to do in Iceland according to tourism professionals, from our survey of the people who plan these trips for a living.
-
Glacier melting rates in Iceland, from 135 years of data. The longer view on the warming this study finds in the Met Office record since the 1960s.
-
Study of the best campsites in Iceland, from 128 campsites and 55,448 Google ratings. June and July, the driest and calmest months here, fall in the main camping season.
Which month did you pick for Iceland, and did the weather agree with the ranking? Tell us in the comments below.

Guide to Iceland Editorials is the shared byline for our content team. We use it on pieces several people worked on together, where no single writer owns the article, and on anything rewritten often enough that a personal byline would be misleading. We also publish our original data studies under this profile. Each study answers a question travelers ask about Iceland, using primary sources such as booking records, traveler reviews and public datasets, and every study is quality checked by human experts before it's published. Everything under this byline is researched and reviewed by people who live and work in Iceland. If you spot something out of date or want to suggest a correction, message us and it reaches the whole team.