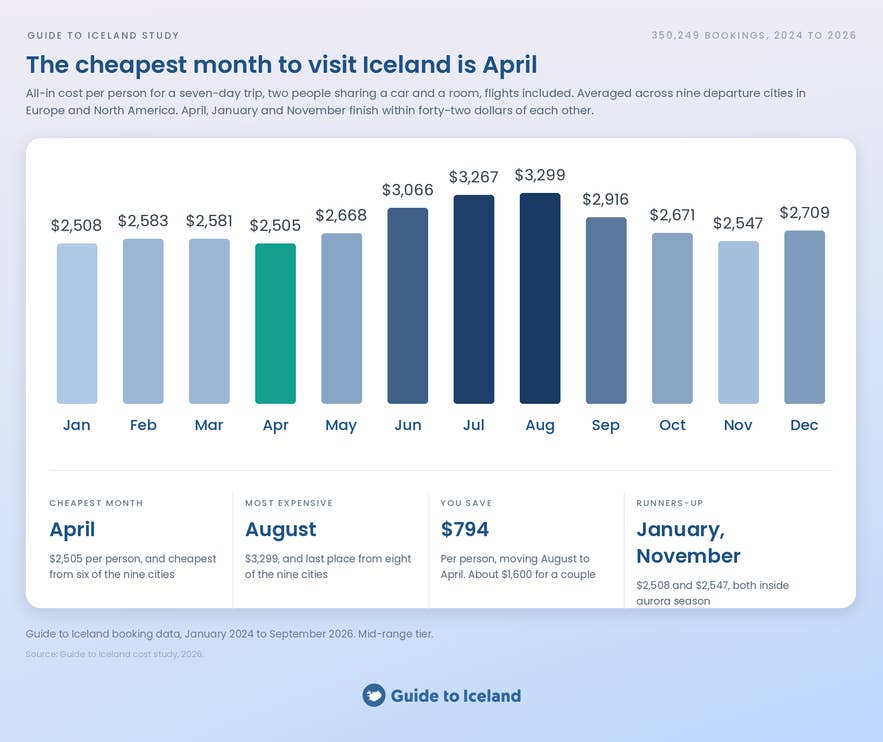
The cheapest month to visit Iceland is April, with January three dollars behind it. This study analyzed 350,249 real Guide to Iceland bookings made between January 2024 and September 2026. It then compared the cost of a full trip with published airfares from nine cities to find when visiting Iceland costs the least.
April was the cheapest month for travelers from six of the nine cities, while January was cheapest for two and November for one. These findings give you a clearer picture of the cheapest time to go to Iceland and how much you could save by choosing a less expensive month.
Why You Can Trust Our Content
Guide to Iceland is the most trusted travel platform in Iceland, helping millions of visitors each year. All our content is written and reviewed by local experts who are deeply familiar with Iceland. You can count on us for accurate, up-to-date, and trustworthy travel advice.
Visiting during one of these months instead of August can cut the total cost of a trip by about a third. The savings come mainly from seasonal changes in flights, car rentals, and accommodation, while prices for tours in Iceland remain relatively steady throughout the year.
Keep reading to see how Iceland trip costs change by budget and season, which expenses fluctuate most throughout the year, and how far ahead travelers tend to book.
Key Findings
-
April, January, and November are the three cheapest months to visit Iceland, at 2,505 USD, 2,508 USD, and 2,547 USD per person all-in for a seven-day mid-range trip.
-
August is the most expensive month, ranking last among eight of the nine departure cities at an average of 3,299 USD. The gap is 754 USD to 876 USD per person, or about 1,600 USD for a couple.
-
A rental car costs 65% more in July than in January for the identical vehicle, and a hotel room costs 49% more in August.
-
Tour prices hardly move. When the same tour is compared across different departure months, the month affects just 0.5% of tour price differences, versus 33% for car rentals and 38% for accommodation.
-
Last-minute rooms are cheaper, not dearer. A room booked within a day of check-in runs 8.8% below one booked six weeks out, and a room booked six to twelve months ahead costs 3.1% more.
-
Self-drive tours cost 27% less per day than guided packages, but they cost more overall, because they run two days longer.
-
Northern lights tours do not run in May, June, or July. Under the midnight sun, the sky never gets dark enough. The season runs September through April.
-
There is no cheap day to book or to travel to Iceland. Five of 36 day-of-week estimates reach significance, but the largest is worth just 1.7%, and most are under 1%.
Cite This Study
The charts and data in this study are free to use under CC BY 4.0. Credit Guide to Iceland and link to this page. Every chart has an Embed button underneath it with ready-to-paste code.
Cost of Traveling to Iceland

Iceland has a reputation for being expensive, and the data does not argue with it.
A mid-range seven-day trip for two people sharing a car and a room costs roughly 256,000 to 333,000 ISK per person, depending on the month, before flights. That is about 2,110 USD to 2,747 USD at current rates.
Three main factors make up the price: getting there, getting around and sleeping, and the things you actually do. Only two of these change significantly with the seasons. Understanding which ones can make a big difference to your total trip cost.
Iceland Trip Cost by Budget Tier

For this study, we grouped bookings into three price tiers based on the prices people actually paid, using the 33rd and 80th percentiles of price.
About a third of bookings fell into the budget tier, almost half into the mid-range tier, and a fifth into the highest tier. This pattern was almost the same for car rentals, accommodation, and tours.
|
Tier |
Car per day |
Room per night, each |
Typical tour |
7 days in April |
7 days in August |
|---|---|---|---|---|---|
|
Budget |
7,500 ISK |
11,643 ISK (96 USD) |
7,100 ISK |
129,998 ISK |
174,436 ISK |
|
Mid-range |
13,398 ISK |
19,772 ISK |
17,490 ISK |
256,003 ISK |
333,331 ISK |
|
Luxury |
23,178 ISK |
38,140 ISK |
37,900 ISK |
527,296 ISK |
672,866 ISK |
The figures above show the median booking in each tier, not the price range used to define the tiers. Trip costs cover seven car-days and six nights, exclude flights, and assume two people sharing one car and one room.
Accommodation is priced per room and divided by two for the per-person figures. Add 177 to 711 USD per person for airfare, depending on where and when you fly. Prices are converted at 121.33 ISK to 1 USD.
Budget travel in Iceland does not necessarily mean using small and cheap rental cars. Half of budget-tier car rental bookings are still SUVs or 4x4s, reflecting Iceland's road conditions.
The biggest difference is accommodation: 52% of budget bookings use a hostel, guesthouse, or apartment.
The most common accommodation names that pop up across 3,249 bookings include:
-
Kex Hostel, with a median of 9,808 ISK per room-night
-
Bolholt Apartments at 22,885 ISK
-
Bus Hostel at 13,804 ISK
Split between two people, those prices come to about 4,900, 11,400, and 6,900 ISK per person, respectively.
Luxury spending stands out more in activities than accommodation. A luxury room costs 93% more than a mid-range room, while a luxury tour costs 117% more. Ice cave tours are the clearest example. They account for 25% of luxury-tier tour bookings, compared with 0.1% in the budget tier.
The data shows that the biggest differences between budget and luxury trips come from the experiences included, rather than simply the room you sleep in.
April Has the Lowest All-In Trip Cost in Iceland
To answer this properly, we need to price a whole trip rather than look at one cost in isolation.
We modelled a seven-day, six-night trip for two people sharing a car and a room, including flights, car rental, accommodation, three-day tours, and food. Each cost changes by month based on the booking data.
Airfares use published monthly median prices from nine departure cities, including six in Europe and three in North America.
All-In Cost per Person by Month
|
Departure city |
Cheapest month |
Cost |
Priciest month |
Cost |
You save |
|---|---|---|---|---|---|
|
London |
January |
2,338 USD |
August |
3,195 USD |
857 USD |
|
Amsterdam |
November |
2,374 USD |
August |
3,250 USD |
876 USD |
|
Copenhagen |
April |
2,406 USD |
July |
3,223 USD |
817 USD |
|
Paris |
April |
2,470 USD |
August |
3,224 USD |
754 USD |
|
Berlin |
April |
2,484 USD |
August |
3,333 USD |
849 USD |
|
Boston |
January |
2,513 USD |
August |
3,366 USD |
853 USD |
|
Frankfurt |
April |
2,528 USD |
August |
3,320 USD |
792 USD |
|
New York |
April |
2,592 USD |
August |
3,374 USD |
782 USD |
|
Toronto |
April |
2,667 USD |
August |
3,458 USD |
791 USD |
Across all nine cities, April has an average trip cost of 2,505 USD per person, followed by January at 2,508 USD and November at 2,547 USD. Only three dollars separate April and January on a trip costing around 2,500 USD, so the difference is minimal.
August is the most expensive month in every city except Copenhagen, where July costs the most. Overall, traveling in the cheapest month instead of August cuts the total cost by 32%.
The three cheapest months come out on top for different reasons.
April has the lowest cost for every ground component: car rental is 0.4% cheaper than in January, accommodation is 5.4% cheaper, and tours are 1.6% cheaper. Together, that saves about 6,168 ISK (51 USD) per person compared with January.
January has the lowest average airfare, at 347 USD across the nine cities, compared with 395 USD in April. The 48 USD airfare difference is almost offset by April's 51 USD saving on ground costs, leaving April just three dollars cheaper overall. For a cheaper trip with less spending on the ground, however, January comes out ahead.
Additionally, we tested the model in eight additional ways: a four-day trip, a 14-day trip, a solo traveler, the budget tier, the luxury tier, a trip without tours, and ground costs without flights.
The result: April, January, and November occupied all 24 of the top-three positions, with April coming first in five of the eight scenarios. January was cheapest for the four-day trip, budget tier, and no-tours trip, where airfare makes up a larger share of the total cost.
No other month reached the top three in any scenario, although the small differences between the three cheapest months mean the exact order can change.
Why April Is the Cheapest Month for an Iceland Vacation

Hotels and accommodation in Iceland are the main reason April beats January. It is the only month when room rates fall below their January level, reaching their lowest point of the year as the winter northern lights season ends and the summer travel season has not yet begun.
Car rental prices remain close to their January low, while April tours also remain relatively affordable. Airfares are still at shoulder-season levels, helping keep the overall cost down.
April has also become one of the best months for weather since 2021. Our study of the best and worst months to visit Iceland ranks April third of the twelve months for 2021 to 2025, behind only July and August. That puts the cheapest month among the best months for dry, calm days.
If you want to know what Iceland is like at this time of year, our guide to Iceland in April covers daylight hours, weather, and road access.
Iceland Flight Prices by Month

Flight prices vary much more by departure region than many travelers might expect.
European fares are much cheaper in winter. London fares fall from 448 USD in August to 177 USD in January, a 153% difference. Amsterdam follows almost the same pattern, with fares ranging from 199 USD in November to 503 USD in August, also a 153% difference.
Copenhagen is the exception, with July as its most expensive month rather than August. Its fares vary by 80% between July and January. Berlin has a 65% difference between its cheapest and most expensive months, while Paris varies by 53%.
For travelers flying from Europe, avoiding the summer peak can make a substantial difference to the total cost of an Iceland trip.
North American fares are less seasonal. New York's fares vary by just 32% across the year, and December is its most expensive month at 636 USD, rather than August. Higher Christmas demand across the North Atlantic pushes December fares above the summer peak.
Boston has the largest seasonal difference among the three US and Canadian cities in the study, with fares ranging from 352 USD in January to 619 USD in August, a 76% difference.
Toronto has the highest fares in the study across all 12 months. Icelandair operates 13 nonstop flights per week year-round, but its cheapest months currently have no nonstop competition.
The January median rose from 432 to 515 USD over the past month, while August fell from 752 to 711 USD, narrowing the difference from 74% to 39%. February is now the cheapest month at 510 USD. Air Canada stops operating the route after late October, leaving Icelandair as the only nonstop carrier through the winter.
Vancouver also has year-round service, but fares are roughly twice those from Toronto. Halifax operates only from June through October, so travelers from Atlantic Canada will need a connection during the winter.
See our study of the best airlines to fly to Iceland for the lowest-cost option from each country.
Costs of an Iceland Trip Over the Next 12 Months
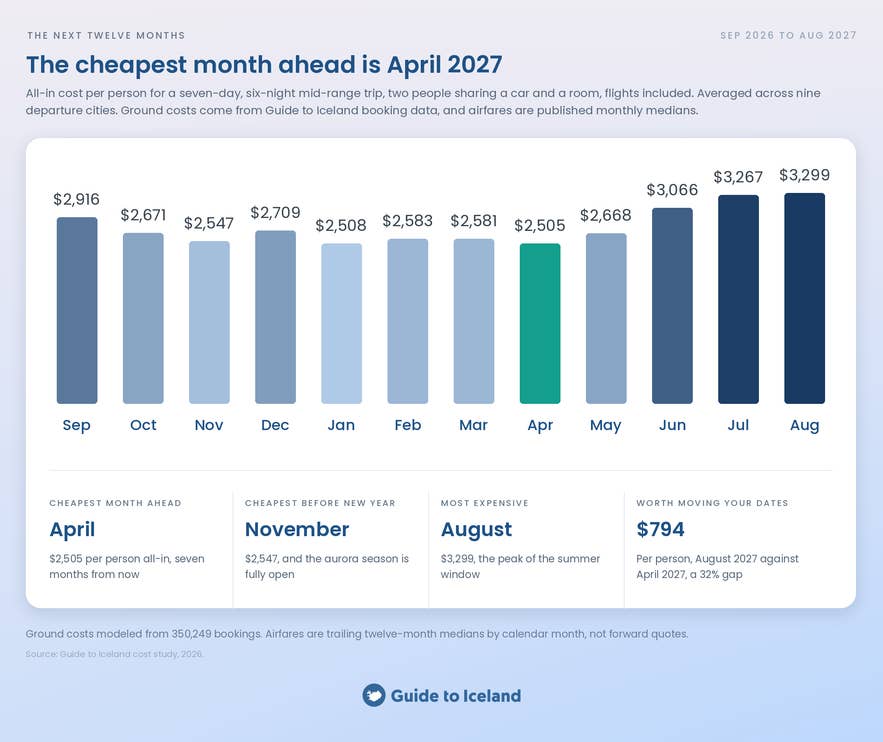
The figures above show what travelers paid in the past. This section uses the same model to estimate the cost of trips taking place over the next 12 months, from September 2026 through August 2027.
The overall pattern changes very little. April 2027 is the cheapest month ahead at 2,505 USD per person, followed by January 2027 at 2,508 USD. November 2026 is the cheapest month you can travel before the new year, at 2,547 USD.
All three are within 42 USD per person of each other, so the differences are small enough that daylight, weather, and seasonal activities may be more useful factors when choosing between them.
Iceland Trip Cost by Month, September 2026 to August 2027
|
Month |
All-in per person |
Flights |
On the ground |
|---|---|---|---|
|
September 2026 |
2,916 USD |
437 USD |
2,479 USD |
|
October 2026 |
2,671 USD |
432 USD |
2,239 USD |
|
November 2026 |
2,547 USD |
372 USD |
2,175 USD |
|
December 2026 |
2,709 USD |
473 USD |
2,236 USD |
|
January 2027 |
2,508 USD |
347 USD |
2,161 USD |
|
February 2027 |
2,583 USD |
388 USD |
2,195 USD |
|
March 2027 |
2,581 USD |
395 USD |
2,186 USD |
|
April 2027 |
2,505 USD |
395 USD |
2,110 USD |
|
May 2027 |
2,668 USD |
424 USD |
2,244 USD |
|
June 2027 |
3,066 USD |
488 USD |
2,578 USD |
|
July 2027 |
3,267 USD |
531 USD |
2,736 USD |
|
August 2027 |
3,299 USD |
552 USD |
2,747 USD |
If you are planning to travel soon, the biggest savings come from waiting until November. September costs 2,916 USD per person, compared with 2,547 USD in November, a difference of 369 USD per person, or about 740 USD for two people.
October brings the cost down to 2,671 USD. After November, prices rise again for December before settling into a relatively steady winter period. January through April are separated by just 78 USD per person.
Summer 2027 follows the same pattern seen in the historical data. June, July, and August all cost more than 3,000 USD per person, with August reaching 3,299 USD, the highest figure in the 12-month period. Moving a summer trip to April could save 794 USD per person.
Keep in mind that these figures are estimates, not live trip quotes. Ground costs are based on what travelers actually paid across 350,249 Guide to Iceland bookings, while airfares use trailing 12-month median prices for each calendar month. The airfare figures are therefore intended to show the general seasonal pattern rather than the exact price of a flight on a specific date.
The small difference between April and January also means there is little reason to choose one based on price alone. Treat April, January, and November as a close group and consider daylight, weather, road conditions, and seasonal activities when deciding when to go.
Our guide to the best time to visit Iceland compares these seasonal factors in more detail.
Why Iceland Tour Prices Barely Change by Season
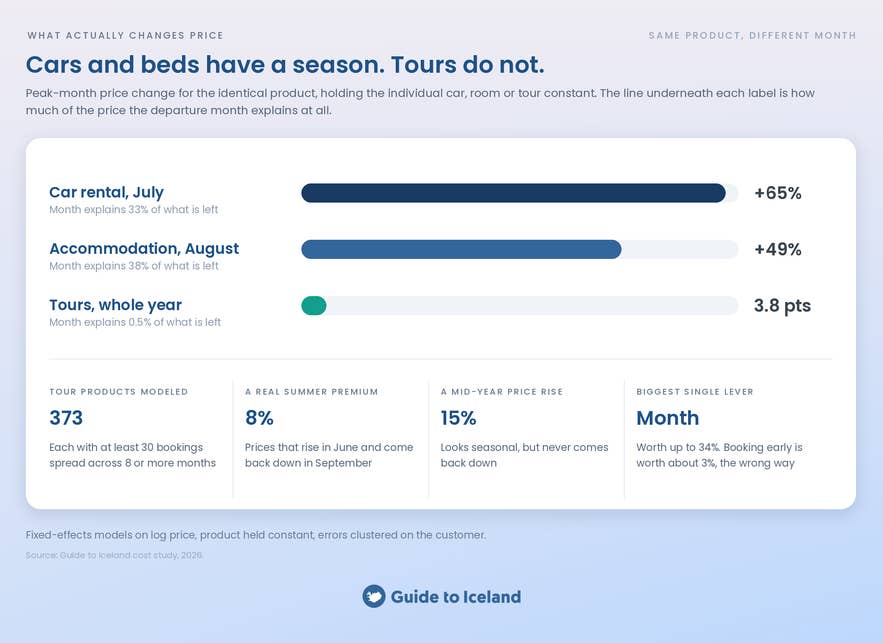
Tour prices in Iceland are much less seasonal than car rentals and accommodation. To find out how much prices actually change, we compared the same car category, hotel room, and tour across different departure months. This removes differences caused by travelers choosing different types of products at different times of year.
Once the same product is compared across months, the departure month accounts for just 0.5% of tour price variation, compared with 33% for car rentals and 38% for accommodation.
Looking at all price differences in the data, including differences between budget and luxury products, month accounts for 23% of car rental variation, 15% of accommodation variation, and just 0.2% of tour variation.
A car can cost 65% more in July than January, and a room can cost 49% more in August, while the full-year price spread across 373 tour products is just 3.8 percentage points.
The exact car and accommodation differences vary depending on the years included in the analysis. Across complete departure years, the July car premium ranges from 55% to 65%, while the August premium ranges from 47% to 65%. The August accommodation premium ranges from 48% to 64%.
Tour prices are much more consistent: the full-year spread stays between 3.1 and 4.3 percentage points across the different tests.
That does not mean tour prices never change. They can rise when an operator updates its prices, for example. The Blue Lagoon Comfort ticket increased from 12,990 ISK in 2024 to 14,490 ISK in 2025, 14,990 ISK in 2026, and 15,990 ISK for 2027 departures, a 23% increase.
Because that higher price remains in place, it is a price update rather than seasonal pricing.
Iceland Tours With Seasonal Pricing
Genuine seasonality is harder to identify than simply comparing summer with winter. A tour that increases its price in June and keeps the new price through the rest of the year has experienced a price change, but not necessarily a seasonal premium.
To separate the two, we checked whether prices that rise during summer fall again afterward. The analysis covered 160 high-volume product-years, each with at least 200 bookings spread across 10 or more months.
|
Pattern |
Share of high-volume tour products |
What it is |
|---|---|---|
|
Flat within 2% all year |
63% |
No pricing by season at all |
|
Summer premium that reverses |
8% |
Real seasonality: the lagoons, Silfra snorkelling, the Reykjavik food walk |
|
Summer rise that sticks |
15% |
A mid-year price revision, not a season |
|
5% or more cheaper in summer |
6% |
Winter-premium products, mostly ice caves and snowmobiles |
Of the 23% of products that appear more expensive in summer, only about a third actually become cheaper again afterward. For example, the Golden Circle minibus with Kerid Crater increased from 11,990 to 13,900 ISK during summer 2025 and remained at 13,900 from September onward.
The Blue Lagoon ticket, by contrast, increased in June and dropped again in September for three consecutive years. The first is a price increase that happened during summer; the second shows genuine seasonal pricing.
Across the full dataset, the average tour is just 1.7% more expensive in summer, while the median shows no difference at all. Genuine seasonal pricing exists, but it affects about one in 12 high-volume tour products. That is why the overall spread across all 373 products remains below four percentage points.
For travelers, the main takeaway is simple: winter trips to Iceland are cheaper mainly because flights, car rentals, and accommodation cost less, not because tours are heavily discounted.
When a tour costs less in winter, it is often because the available activity or product is different. The bigger seasonal difference is therefore which activities are available, rather than how much the same tour costs.
Golden Circle Tour Prices by Month
One of the most popular day trips in Iceland is remarkably steady in price across the year. Neither becomes meaningfully cheaper in winter, so waiting for the low season will not reduce the cost of the tour itself.
The Golden Circle is the closest thing Iceland has to a fixed-price day trip. Across 16,834 bookings, the monthly median ranges from 13,399 ISK in May to 13,990 ISK in August, a whole-year difference of just 4.4%.
If you hold the individual tour constant, the range is 5.3%, showing that the small amount of movement comes from the tours themselves rather than major changes in what people are booking. One hundred of the 165 Golden Circle day tours currently on sale run in all 12 months.
An earlier edition of this study, based on just five months of capped data, reported a March median of 29,518 ISK and appeared to show a winter premium. The larger dataset shows otherwise. With at least 860 bookings in every month, the Golden Circle and snowmobile or super-jeep combinations that pushed March higher now sit in their proper proportion, and the overall category is essentially flat.
If you are driving the route yourself, see our guides on how to drive the Golden Circle and the top nine Golden Circle detours.
Your Main Takeaway: There is no single cheapest month for the Golden Circle tour category. The small price differences mean that your flight and accommodation costs are more important when choosing a month.
South Coast Tour Prices by Month
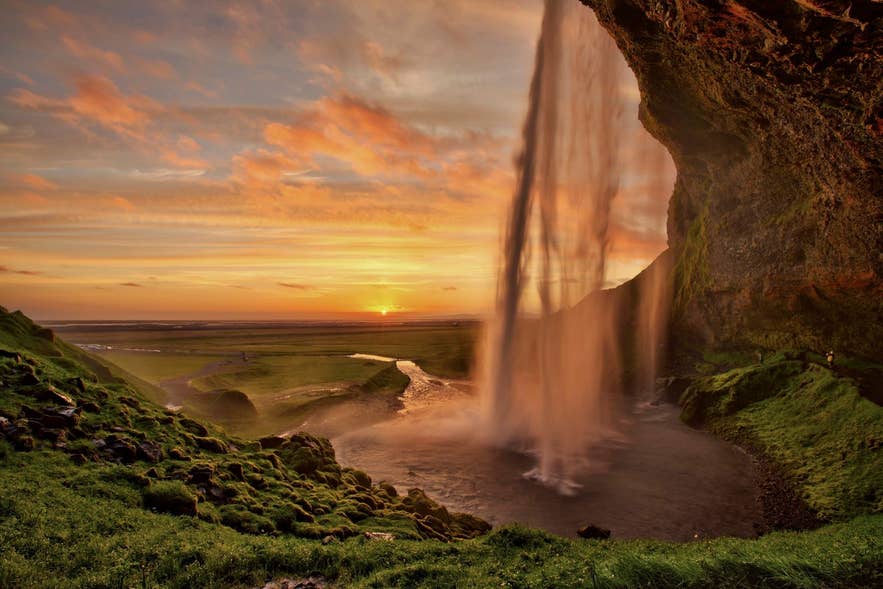
The South Coast looks more seasonal, but this is where the difference between the overall category and individual products becomes important. Across 5,038 bookings, the monthly median ranges from 16,990 ISK in May to 19,990 ISK in December, a 17.7% difference. Hold the individual tour constant, however, and the range falls to just 4.7%.
The apparent winter premium mostly comes from a change in what travelers book, not what the tours cost.
From October to April, the category includes more ice cave combinations, particularly tours visiting the Crystal Blue Ice Cave in Vatnajokull.
From May to October, glacier hikes and Jokulsarlon kayaking become more common. Of the 207 South Coast day tours currently on sale, 117 run all year, including tours that visit Reynisfjara Black Sand Beach.
A December South Coast tour often costs more than a May tour because it is a different, longer itinerary that includes an ice cave.
Your Main Takeaway: No particular month offers a clear price advantage for South Coast tours. The monthly figures tell you more about which experiences are available than about seasonal tour pricing.
October is a useful point in the calendar to consider because ice cave tours have opened while many summer glacier and kayaking options are still available.
Iceland Packages vs. Self-Drive Tours: Cost & Value
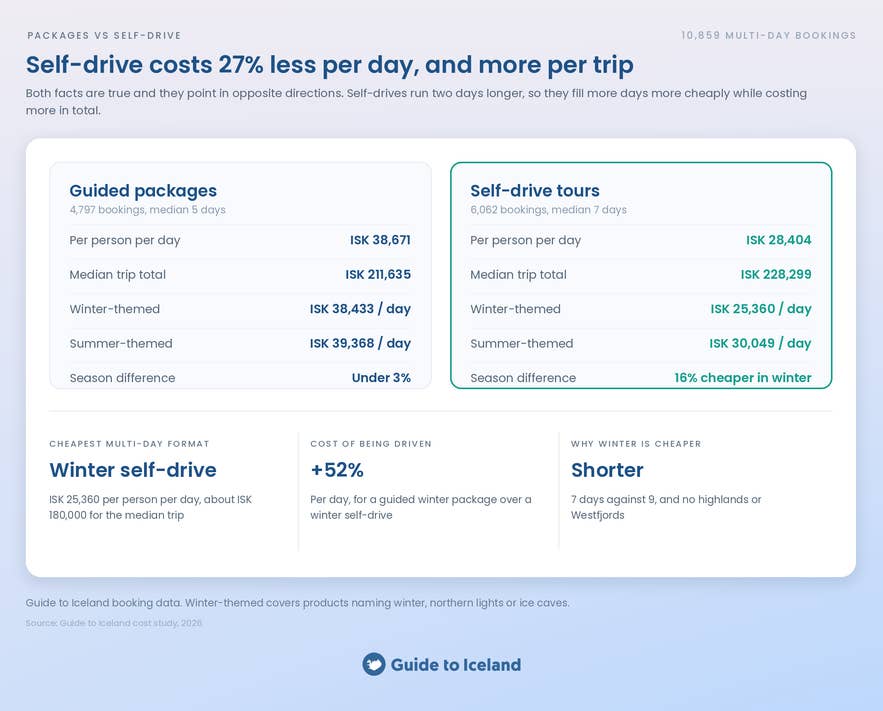
Guide to Iceland sold 4,797 guided vacation packages and 6,062 self-drive tours during the study period.
The median guided package lasts five days and costs 38,671 ISK per person per day, while the median self-drive lasts seven days and costs 28,404 ISK per person per day. That makes self-drive tours 27% cheaper per day.
The typical self-drive, however, costs more overall: 228,299 ISK per person, compared with 211,635 ISK for a guided package, because it lasts two days longer.
The difference comes down to what you are comparing. Self-drive tours cost less per day, while guided packages cost less for the typical trip overall. A self-drive gives you more days in Iceland for the money, while a guided package costs less in total because the itinerary is shorter.
Package and Self-Drive Prices by Season
|
Product type |
Bookings |
Median length |
ISK per person per day |
Median total per person |
|---|---|---|---|---|
|
Guided packages |
4,797 |
5 days |
38,671 |
211,635 |
|
Guided winter packages |
3,592 |
5 days |
38,433 |
205,322 |
|
Guided summer packages |
1,205 |
6 days |
39,368 |
240,057 |
|
Self-drive tours |
6,062 |
7 days |
28,404 |
228,299 |
|
Self-drive tours in winter |
2,210 |
7 days |
25,360 |
179,869 |
|
Self-drive tours in summer |
3,852 |
9 days |
30,049 |
259,008 |
Winter self-drives are genuinely cheaper. They cost 25,360 ISK per person per day, compared with 30,049 ISK for summer self-drives, a 16% difference. This reflects the itineraries themselves rather than a simple seasonal discount.
Self-drives in winter typically last seven days instead of nine, focus more closely on the South Coast, and avoid the Highlands and Westfjords. In other words, the lower price comes with a shorter and more limited route.
Guided packages change very little by season. Winter packages cost 38,433 ISK per person per day, compared with 39,368 ISK in summer, a difference of less than 3%. The season therefore has little effect on the daily price of a guided package.
If daily cost is your main concern, a winter self-drive has the lowest median price at 25,360 ISK per person per day, or about 180,000 ISK for the typical seven-day trip. A guided winter package costs 38,433 ISK per day, making it 52% more expensive per day. The higher price covers the convenience of having someone else handle the driving, including in winter conditions.
Self-drive travelers also tend to plan further ahead. The median self-drive tour is booked 76 days before departure, compared with 53 days for a guided package. Only one self-drive booking in the entire dataset was made on the day of departure, showing how much earlier travelers tend to plan road trips in Iceland.
When To See the Northern Lights in Iceland
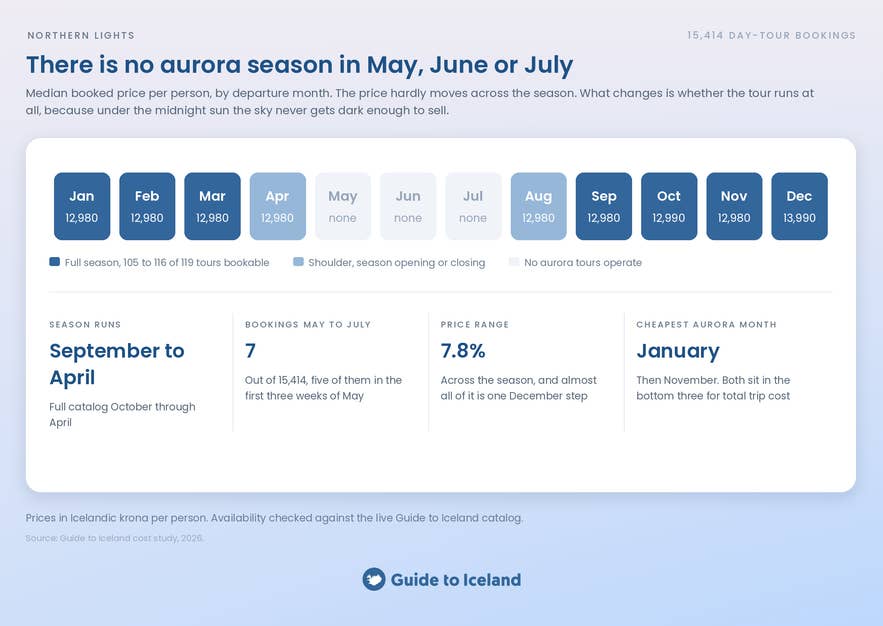
Northern lights tours are unusual in this study because the month has little effect on price but a major effect on availability.
Across 15,414 bookings, the median tour price is 12,980 ISK per person in January, February, March, April, August, September, and November. October is only 10 ISK more expensive at 12,990 ISK, while December is the only month with a noticeable increase, at 13,990 ISK.
The full seasonal price range is just 7.8%, and holding the individual tour constant gives a similar range of 7.4%.
Northern Lights Tour Availability by Month
|
Month |
Bookings in our data |
Median price (ISK) |
Tours bookable |
Status |
|---|---|---|---|---|
|
January |
2,031 |
12,980 |
115 of 119 |
Full season |
|
February |
2,678 |
12,980 |
116 of 119 |
Full season |
|
March |
2,664 |
12,980 |
116 of 119 |
Full season |
|
April |
757 |
12,980 |
92 of 119 |
Season closing mid-month |
|
May |
— |
— |
0 |
No aurora season |
|
June |
— |
— |
0 |
No aurora season |
|
July |
— |
— |
0 |
No aurora season |
|
August |
213 |
12,980 |
13 of 119 |
Season opening |
|
September |
1,348 |
12,980 |
105 of 119 |
Full season |
|
October |
1,860 |
12,990 |
111 of 119 |
Full season |
|
November |
1,584 |
12,980 |
112 of 119 |
Full season |
|
December |
2,279 |
13,990 |
113 of 119 |
Full season, priciest |
May, June, and July have no regular northern lights tour season. In late June, Reykjavik gets around 21 hours of daylight, and the sky never becomes properly dark.
While 12 northern-lights-tagged products appear as bookable during these months, we checked each one against its actual offering. They consist of an indoor museum, nine private charters available year-round, and two dining experiences. None is a genuine aurora-hunting tour.
The booking data tells a similar story. Just 27 bookings across May, June, and July carried a northern-lights tag among the 15,414 bookings in the rest of the year. Twelve were for the Aurora Reykjavik Museum, while eight were multi-day tours that included an aurora experience in their winter itinerary.
That leaves seven genuine northern lights day tours with summer departure dates: five in May, one in mid-June, and one in late July. These seven bookings represent just 0.05% of the total, and most took place during the first three weeks of May, when the skies around Reykjavik can still become dark enough to see the northern lights.
If you’re planning an aurora trip, see our guide to the best time to see the northern lights in Iceland, and use the northern lights forecast to find the best viewing conditions.
Cheapest Month For a Northern Lights Trip in Iceland
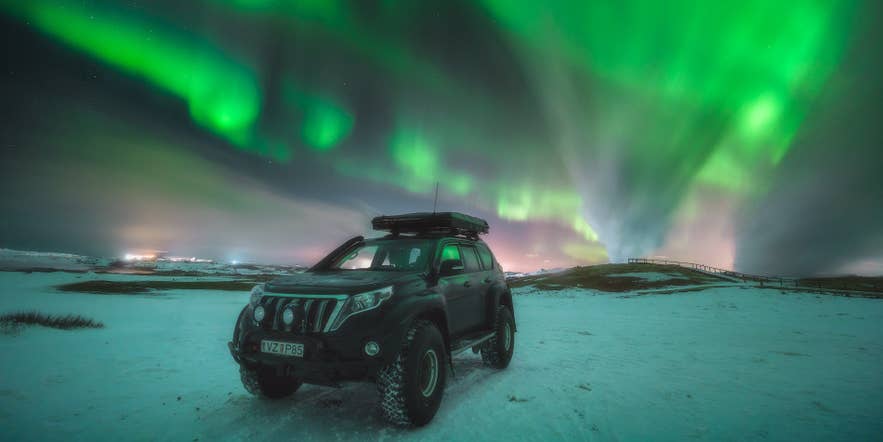
January is the cheapest month for a northern lights trip, followed by November. The tour itself costs almost the same throughout the season, so the biggest savings come from flights, accommodation, and car rental.
January and November are both among the three cheapest months for a full Iceland vacation, while also offering most of the northern lights tour catalogue. Out of the 119 products, 115 are available in January and 112 in November.
April is slightly cheaper overall, but its aurora season closes during the month, and only 92 of 119 tours are bookable.
December is the most expensive month for aurora travel. Its median tour price rises to 13,990 ISK, while average airfare across the nine departure cities reaches 473 USD.
When To Book an Iceland Trip
This is one of the most common questions travelers ask, and the answer is later than you might expect.
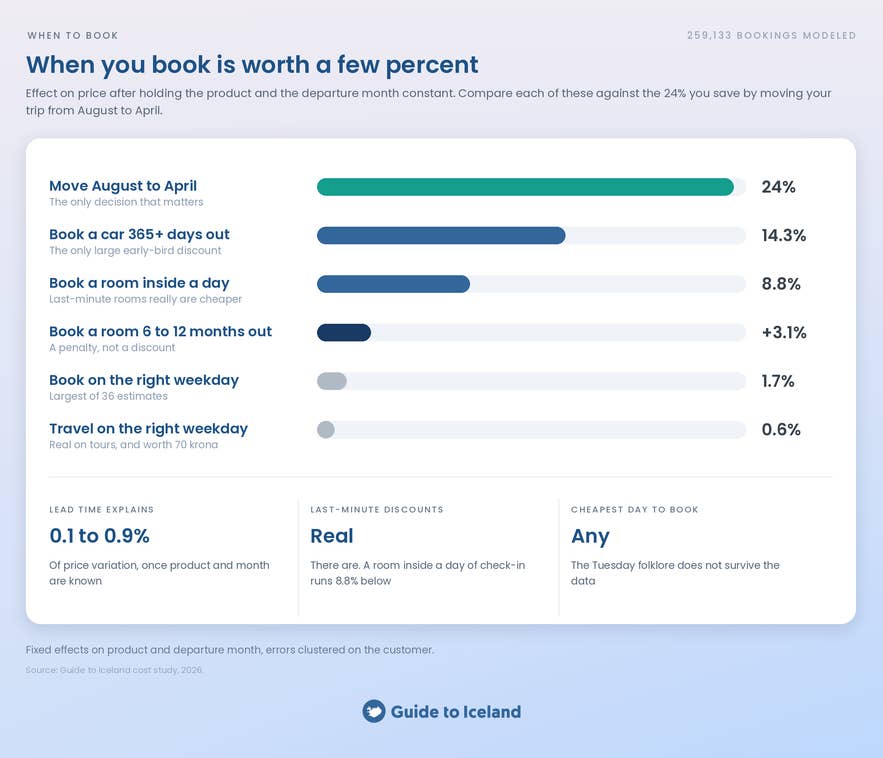
Booking a room close to your check-in date is actually cheaper on average, while booking six months ahead costs more. We ran the same fixed-effects model, holding both the product and departure month constant, so the remaining difference reflects when the booking was made for the same trip in the same month.
Lead time explains between 0.1% and 0.9% of the remaining price variation after accounting for the product and departure month. Here are the effects that hold up in the data:
-
Last-minute rooms really are cheaper. A hotel room booked within a day of check-in costs 8.8% less than one booked 31 to 60 days ahead, while a room booked within a week costs 2.4% less. This is the largest reliable lead-time effect in the data.
-
Booking a room far ahead costs more, not less. Six to 12 months ahead is 3.1% more expensive than six weeks ahead. Three to six months costs 1.4% more, and two to three months costs 0.9% more. The pattern runs against the usual early-booking advice all the way out to a year.
-
Cars only reward very early booking. A car booked 365 days or more ahead is 14.3% cheaper. That discount applies to just 0.4% of car bookings because very few people book that far ahead.
-
Tour prices do not change with lead time. Every tour lead-time coefficient is within 1.2%, and the statistically significant ones are within 0.4%. With 212,466 bookings, the dataset is large enough to detect small effects, but there is no meaningful price pattern to detect.
Your Main Takeaway: Book when you know your dates. Booking a room early gives you more choice but costs about 3% more on average, while waiting can save a few percent at the risk of losing the room you want. Neither difference is large enough to plan a trip around.
Moving a trip from August to April, by comparison, cuts the total cost by 794 USD per person, roughly 35 times the effect of the booking window.
The one exception is cars booked more than a year ahead, where the data shows a 14.3% saving. Otherwise, book early for the tour or room you want, rather than trying to time the booking for a lower price.
How Far Ahead People Actually Book Iceland Trips
The median Iceland booking is made 42 days before departure. A quarter are made within two weeks, 41% within a month, and 8% more than six months ahead. Only 2.2% are made on the departure date itself.
Hotels are booked furthest ahead, with a median of 77 days, followed by cars at 55 days and tours at 32 days.
|
Product |
Median days ahead |
Middle half |
Booked same day |
|---|---|---|---|
|
Hotel room |
77 |
37 to 139 |
0.0% |
|
Car rental |
55 |
22 to 116 |
0.8% |
|
Self-drive tours |
76 |
37 to 138 |
0.0% |
|
Guided packages |
53 |
23 to 107 |
0.0% |
|
Airport transfers |
31 |
8 to 75 |
2.9% |
|
Blue Lagoon |
35 |
12 to 80 |
1.3% |
|
Ice caves |
28 |
8 to 64 |
2.2% |
|
Golden Circle |
28 |
7 to 68 |
1.1% |
|
South Coast |
24 |
7 to 60 |
0.8% |
|
Northern lights |
22 |
2 to 60 |
13.2% |
“Same day” means the booking and departure fall on the same calendar date. Hotel check-ins do not have a time of day in the data, so a hotel cannot register as a same-day booking. Its latest possible booking is therefore the afternoon before check-in.
Northern lights tours are the clear outlier, and the reason is the weather and aurora forecast. A quarter of aurora bookings are made within two days of departure, and 13.2% are made on the day itself, about 10 times the Blue Lagoon rate.
This means that travelers are watching the forecast before deciding to book a northern lights tour. No other product in the table has a first-quartile lead time under seven days.
The hour of booking shows a similar pattern. Tour bookings peak at 15:00 UTC and reach their lowest point at 05:00, with 59% made between noon and midnight.
Aurora bookings peak an hour earlier, at 14:00, with 60% made between noon and midnight. Among the 2,036 aurora tours booked on their departure date, the median booking time is 13:00, compared with a median departure time of 20:00. Forty-six percent are booked between noon and 18:00, while only 12% are booked after 18:00.
That means same-day aurora bookings are generally made in the afternoon, several hours before the evening departure, rather than as last-minute bookings after dark.
Lead times also change with the season, and not in the direction you might expect. January departures are booked a median of 21 days ahead, compared with 58 days for May departures. Winter travelers tend to make their decisions closer to departure, with the entire first quarter averaging less than a month of lead time.
There Is No Cheapest Day To Book or Travel to Iceland

There is no specific day of the week that consistently offers lower prices for booking or traveling to Iceland.
We tested 259,133 bookings in product-month cells large enough to make within-category comparisons, comparing each product with itself within the same departure month. This removes the effect of seasonality and differences in the mix of products being sold.
Five of 36 coefficients pass the 5% significance threshold. The statistically significant tour effects are small: Friday, Saturday, and Sunday departures cost about 0.55% more than the reference days, with p-values below 0.001.
With 212,466 tour bookings in the model, the large sample makes it possible to detect differences this small. On a Golden Circle ticket, 0.55% is only about 70 krona.
The largest coefficient in the model is for a room booked on a Sunday, at 1.67%. None of the 12 car coefficients reach statistical significance.
An earlier edition of this study reported a 3.6% Thursday penalty for car bookings, but that estimate came from an untrimmed sample and disappeared after removing the highest and lowest 0.5% of prices.
Booking volume does have a clear weekly pattern. Sunday is the busiest booking day, with 59,657 bookings, while Friday is the quietest at 43,990, a 36% difference.
Your Main Takeaway: Book and travel on the day that suits you. For the ground portion of an Iceland trip, weekday effects are below 2%, and below 1% for most products.
Also, people are more likely to make travel bookings at the weekend, but that difference in demand does not translate into a meaningful difference in what they pay.
Iceland on a Budget, Mid-Range, or Luxury
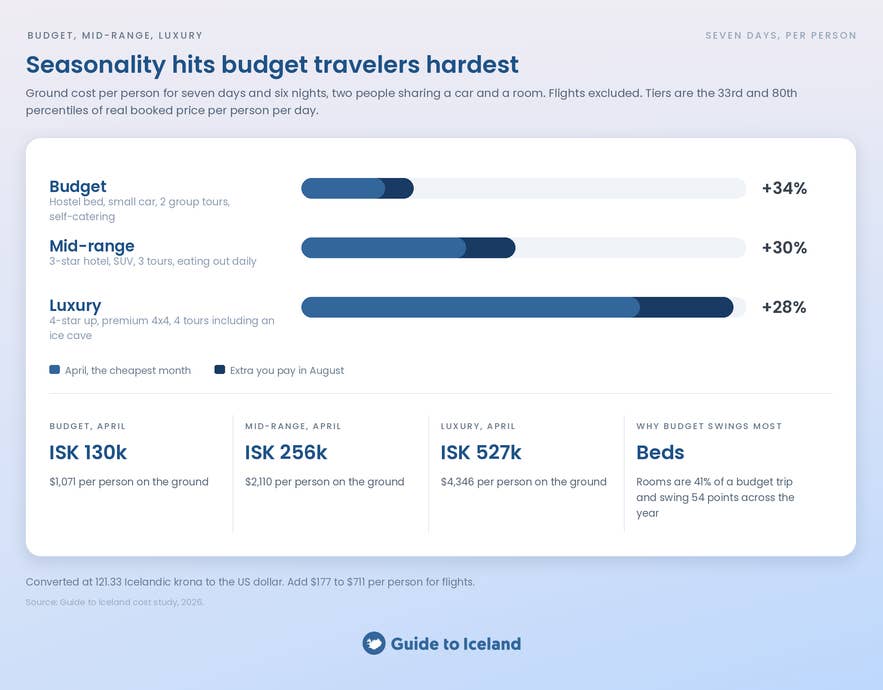
All three tiers have their lowest ground costs in April and their highest in August, but the difference is larger for cheaper trips.
A budget trip costs 34% more in August than in April, compared with 30% for a mid-range trip and 28% for a luxury trip. Seasonality, therefore, has the biggest effect on budget travelers.
Cars have the largest seasonal price changes in percentage terms, while accommodation is the larger seasonal expense overall. Accommodation makes up 41% of a budget trip in April, compared with a smaller share of a luxury trip.
Luxury travelers spend more of their budget on tours, which change very little by season. If you are traveling on a tight budget, choosing cheaper travel dates can therefore make a bigger difference.
What the Booking Data Shows About Saving Money in Iceland
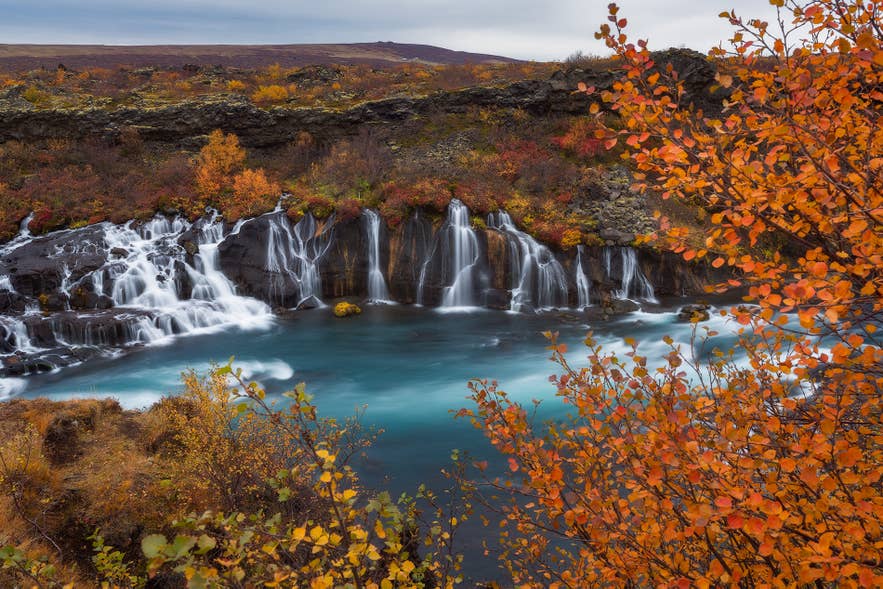
The study highlights several practical ways to save money in Iceland, especially if you are traveling on a tighter budget.
-
Choose your travel dates carefully. If you are traveling on a tight budget, moving your trip from August to April can make a bigger difference than it would for a luxury trip.
-
Cook some of your own meals. Self-catering is the biggest controllable expense. Shopping for groceries in Iceland can reduce food costs from 11,000 to 6,000 ISK per person per day.
-
Choose affordable restaurants. If you are eating out, see our guide to the best value places to eat in Reykjavik.
-
Consider a camper van. Camper van rentals combine your transport and accommodation costs into one expense.
-
Plan for parking. Parking in Reykjavik is a cost many first-time visitors overlook, especially when staying in the capital.
-
Compare regions before choosing where to stay. Our guide to where to stay in Iceland covers the main regional trade-offs. Reykjavik accommodation is where many trips start and end.
What Makes an Iceland Trip More Expensive
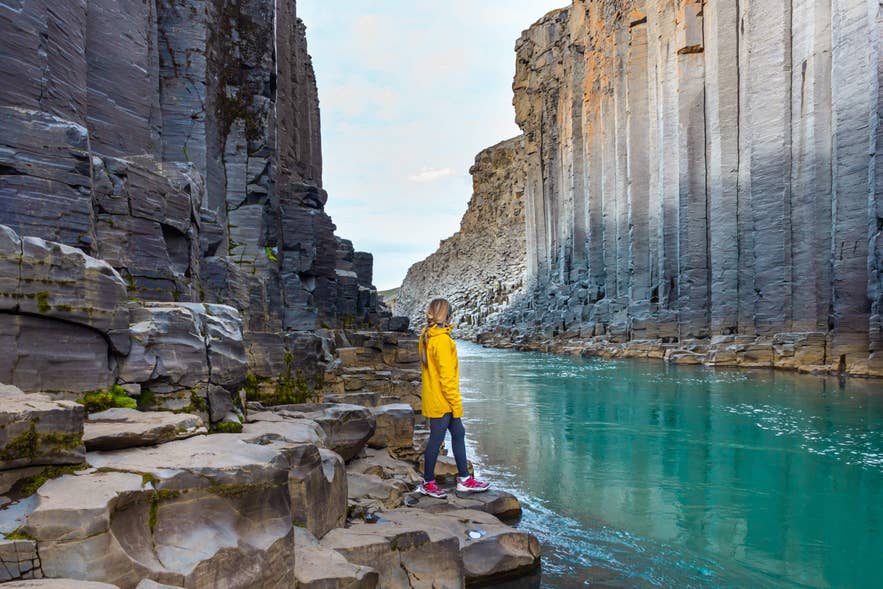
The price of a trip to Iceland varies more by travel style than by any other factor. The clearest summary from 350,249 bookings is this: a budget seven-day trip in April costs about 1,071 USD per person on the ground, plus a flight of approximately 177 USD.
The same seven-day trip at luxury level in August costs 5,545 USD per person, plus a flight of up to 711 USD. That is a fivefold difference between the cheapest and most expensive versions of a trip in the same country and year.
Three factors make the biggest difference to the total cost: your travel tier, whether you share a car and room, and which month you visit. The choice of budget, mid-range, or luxury travel creates the largest gap, while sharing a car and room can cut those costs substantially.
Travel month can change the total by up to 34%. The timing and day of your booking have a much smaller effect on what you pay.
For a closer look at typical prices for food, accommodation, transportation, and activities, see our full guide to how expensive Iceland is.
How We Did This Study on the Cheapest Time To Visit Iceland

We analyzed 350,249 bookings from 219,245 separate transactions made by 129,934 customers.
The bookings were made through Guide to Iceland between January 2024 and September 2026, with departures running through October 2027. The dataset includes 25,064 car rentals, 76,185 hotel bookings and 249,000 tour bookings.
The raw export contained 367,896 records. We also used 831 live products and 685 properties from the current Guide to Iceland catalogue, along with monthly airfare medians for nine routes to Keflavik International Airport.
This is the third edition of the study. The first used six CSV exports that were silently capped at 15,000 rows each. The second removed that data limit. For this edition, we also audited the analysis code and corrected five errors identified in the earlier methodology.
What We Dropped, and Why
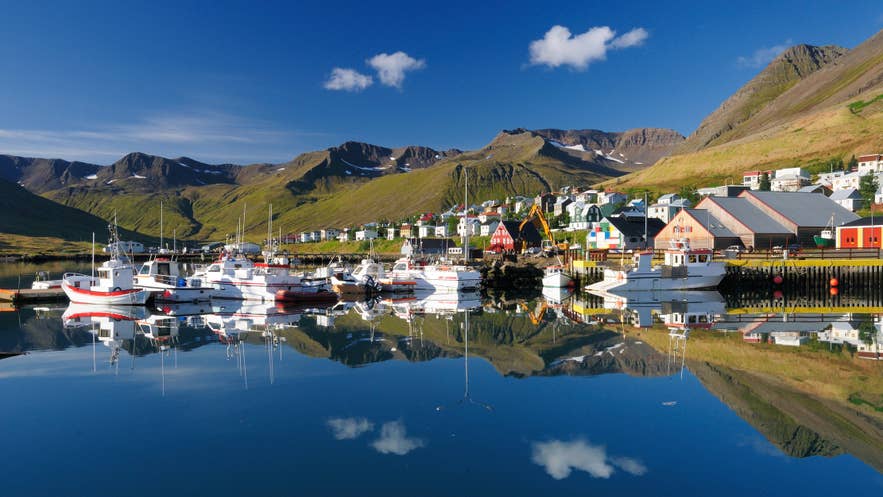
Simple monthly averages can give a misleading picture because the mix of products changes with the season. For example, travelers tend to rent larger cars and choose more expensive rooms in July.
Instead, the main price estimates come from a fixed-effects model using log price, which holds the individual product constant. This lets us compare the same car, room, or tour across different months.
For lead time and day-of-week effects, we also controlled for the departure month. This prevents seasonal differences from being mistaken for booking-timing effects.
Standard errors are clustered by customer. Earlier editions clustered by both customer and booking timestamp, which could split a single shopping session into separate clusters when someone checked out twice. That made the estimated intervals roughly one-sixth to one-tenth too narrow.
Each Iceland customer accounts for an average of 2.9 hotel rows. Accommodation is priced per room-night throughout the study and divided by two when describing the cost for two people sharing.
There are four important limits to keep in mind:
-
Car and hotel seasonality figures are ranges, not single fixed estimates. When complete departure years are estimated separately, the July car premium ranges from 55% to 65%, while the August premium ranges from 47% to 65%. The August room premium ranges from 48% to 64%. The figures quoted elsewhere in the study use the pooled estimate. Tour seasonality is much more stable, with a spread of 3.1 to 4.3 percentage points across the different specifications tested.
-
Hotels cannot register a same-day booking. Check-in dates do not include a time of day, so a booking made on the morning of arrival produces a negative lead time and is filtered out. The shortest observable hotel booking window is therefore the afternoon before check-in.
-
Airfares are historical medians, not live quotes. They are trailing 12-month medians by calendar month, mapped onto the forward booking window. Airfare is also the only major trip component not measured directly from booking data. Because it affects the small difference between April and January, the three cheapest months should be read as a close group: April, January, and November.
-
Cancelled bookings with a realized price remain in the dataset. The price is still a price charged by the platform, even if the booking was later cancelled. These bookings account for 18% of the sample. Removing them changes the median room-night price by just 0.2%.
More Guide to Iceland Data Studies
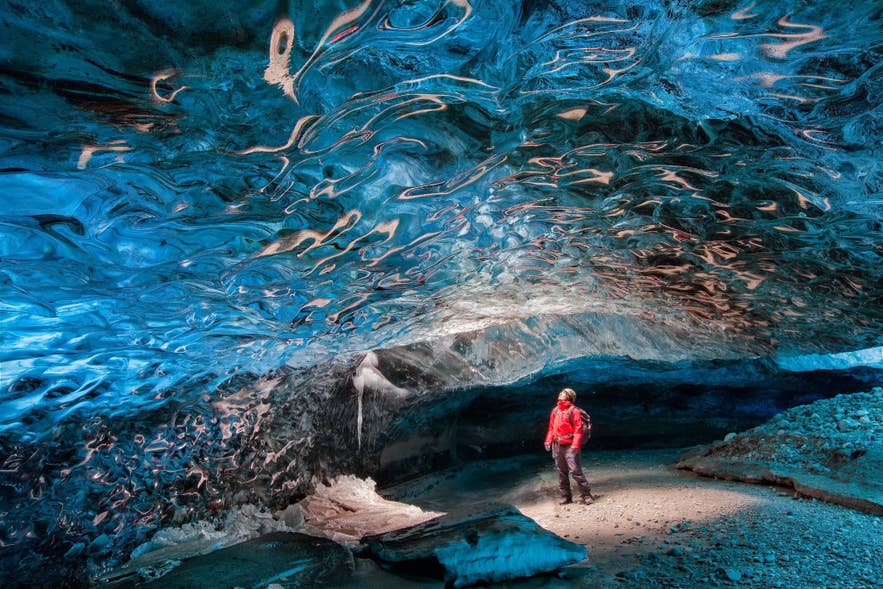
This study is part of a series using our own booking, weather, and review data to answer common questions about visiting Iceland. If you want to look more closely at the seasonal factors covered here, these studies explore them in more detail:
-
The best time to visit the Blue Lagoon looks at crowd levels and pricing by hour at Iceland's most-booked single attraction, which also appears frequently in this study's booking data.
-
The best and worst months to visit Iceland: a weather study examines rainfall, wind, temperature, and road-closing storms by month. Read it alongside this study to see what Iceland's cheapest months are actually like.
-
The best time to visit ice caves in Iceland looks at when the caves are open, when they are less crowded, and the best times of day to visit.
-
The safest month to visit Iceland's ice caves examines freeze-thaw cycles, glacial river discharge, and cancellation rates, adding context to the October-to-April ice cave season found in the booking data.
-
The best time to visit Jokulsarlon and Diamond Beach compares seasonal ice, weather, crowds, and tour availability. It identifies April as a good balance of lagoon ice, improving weather, and fewer crowds.
Conclusion
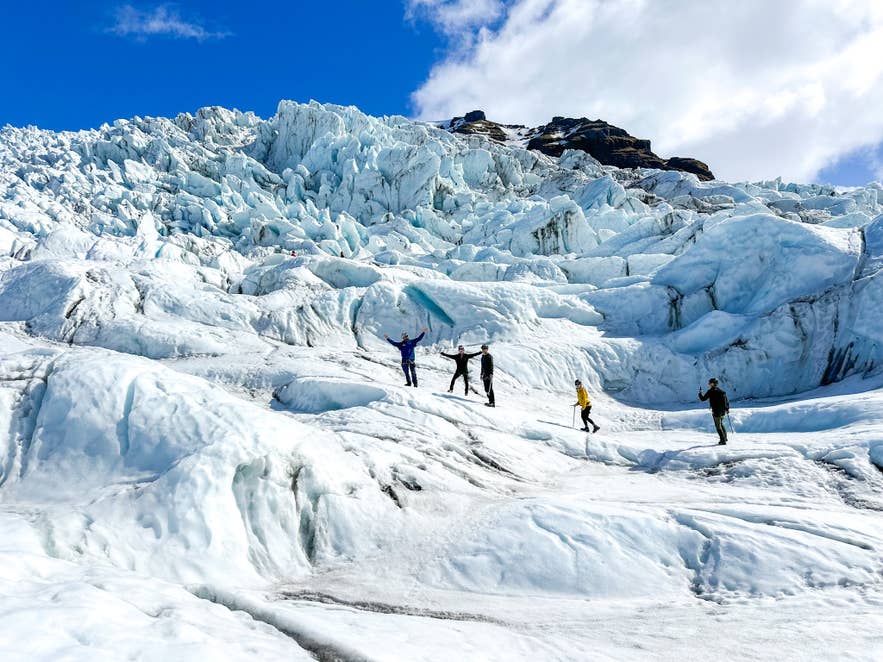
The cheapest time to visit Iceland depends on what you want to do, not just what the trip costs. Many popular tours change little in price throughout the year, but their availability can change significantly.
Northern lights tours have a median price of about 12,980 ISK in February and September, for example, but there is no regular aurora season in June. Blue ice cave tours operate from October to April, while Golden Circle tours stay within a few dollars of the same price throughout the year.
A practical approach is to start with the experiences you want to do, check when they are available, and then choose the least expensive month within that period. In the forward-looking trip model, April, January, and November are within 42 USD of each other, making the price difference between them relatively small.
Daylight, weather, road conditions, and seasonal activities can therefore be more useful when choosing between these months. April offers longer days and the start of puffin season, while January and November fall within the main northern lights season.
If you have not yet decided what to prioritize, check out our guide on what to do with 6 days in Iceland. When you are ready to plan your trip, browse tours and holidays, compare car rental options, and choose where to stay in Iceland.
What is the cheapest month to visit Iceland?
Is it cheaper to visit Iceland in winter?
How much does a week in Iceland cost?
How far in advance should I book a trip to Iceland?
What time of day do people book northern lights tours?
Planning a trip to Iceland? What are you budgeting for your trip, and which costs are you most interested in? Let us know in the comments below.

Guide to Iceland Editorials is the shared byline for our content team. We use it on pieces several people worked on together, where no single writer owns the article, and on anything rewritten often enough that a personal byline would be misleading. We also publish our original data studies under this profile. Each study answers a question travelers ask about Iceland, using primary sources such as booking records, traveler reviews and public datasets, and every study is quality checked by human experts before it's published. Everything under this byline is researched and reviewed by people who live and work in Iceland. If you spot something out of date or want to suggest a correction, message us and it reaches the whole team.