This Guide to Iceland study examines the best time to visit Jokulsarlon and Diamond Beach using satellite images, booking records, and traveler reports. It compares seasonal ice cover, weather, crowds, and tour availability to help travelers plan their visit.
The amount of ice at Jokulsarlon Glacier Lagoon, one of Iceland’s best-known glacier lagoons, changes throughout the year. Some days the lagoon is crowded with icebergs, while others show more open water. Diamond Beach, across the road, can have little ice even when the lagoon holds plenty.
To examine the seasonal pattern, we analyzed 185 usable Sentinel-2 satellite images taken between 2017 and 2026. We measured how much of the lagoon was covered by ice in each image.
The analysis also used 1,457 Sentinel-1 radar images, which work through cloud and winter darkness, and about 50,000 Guide to Iceland bookings. These covered Jokulsarlon tours, including boat rides, kayaking experiences, ice cave visits, and guided day trips from Reykjavik.
Dated public photos and first-hand traveler reports helped assess conditions on Diamond Beach. Icelandic Met Office weather records, Ring Road traffic counts, and satellite images going back to the 1980s added context.
Based on the combined findings, we recommend visiting Jokulsarlon in April for its balance of lagoon ice, improving weather, and fewer crowds. The best month for your trip also depends on the activities you want to do, and beach ice remains unpredictable.
Key Findings
-
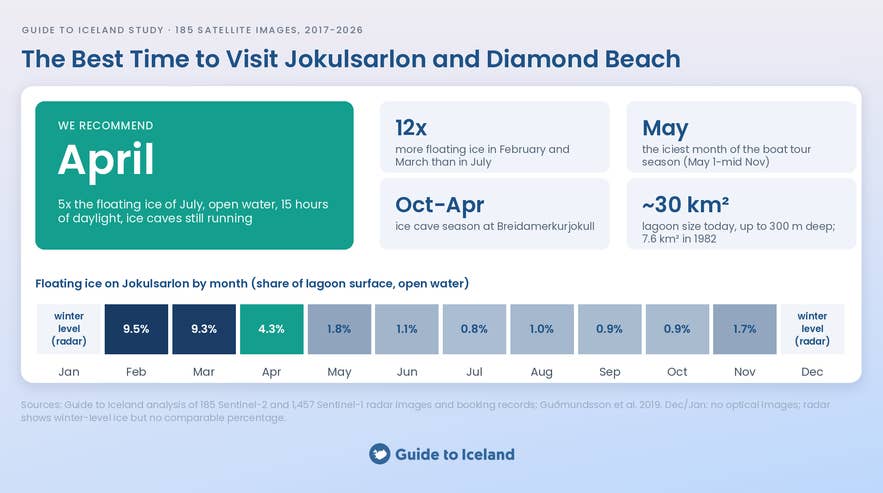
April offers the best overall balance of ice, access, and fewer crowds. Median ice cover was 4.3%, about five times July’s level. Recorded weather or road cancellations affected 0.4% of bookings on the 16 tours from Reykjavik, compared with 2.7% in February.
-
February and March had the highest measured ice cover outside frozen or densely packed conditions. Medians were 9.5% and 9.3%, about 12 times July’s 0.8%. Half of February images and a third of March images exceeded 30% ice cover, so more winter ice does not always mean more separate floating icebergs.
-
Diamond Beach has no clear best season supported by the available evidence. Ice near the lagoon’s outlet peaked in late winter, but photos and traveler reports did not show a matching seasonal pattern on the beach. Plenty of lagoon ice does not guarantee plenty on the sand.
-
May offers more lagoon ice and fewer boat bookings than peak summer. Median ice cover was 1.8%, the highest during the boat-tour season and more than double July’s level. May also had about half of August’s boat bookings.
-
Boat and ice cave tours overlap in fall. Booking records showed amphibian boat tours operating from May into mid-November and ice cave tours from the lagoon operating from October to April. Overlapping departures fell in October and early November, with availability dependent on conditions.
Cite This Study
The charts and data in this study are free to use under CC BY 4.0. Credit Guide to Iceland and link to this page. Every chart has an Embed button underneath it with ready-to-paste code.
How Was This Study of Jokulsarlon Conducted?
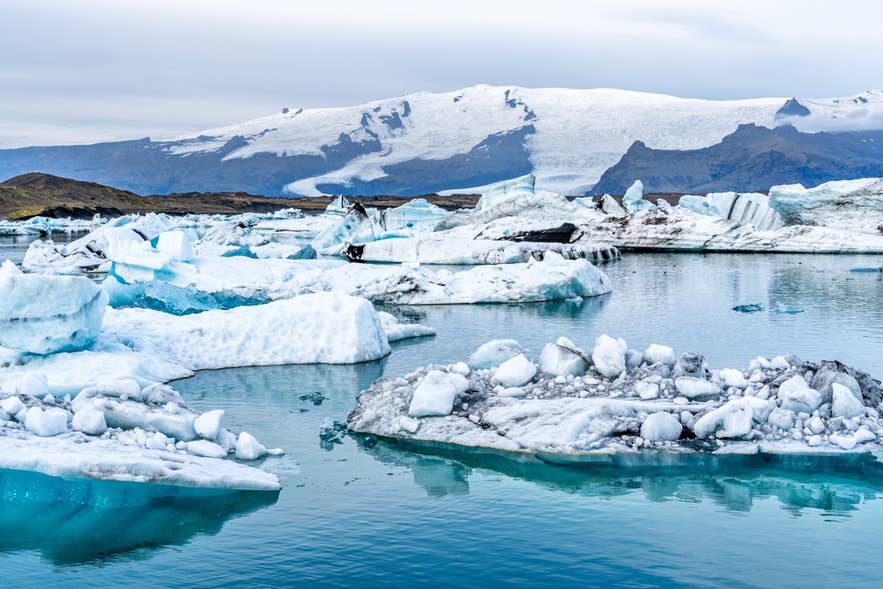
The study combines satellite images, Guide to Iceland booking records, public photos, and traveler reports. Weather and traffic records provide seasonal context, while published research explains the lagoon’s growth and the glacier’s retreat.
Ice measurements used 185 usable images from the Copernicus Sentinel-2 satellite collection, covering February 2017 to September 2026. Images were limited to one per day, with at least 92% of the measured area visible and cloud-free.
Ice was identified using differences in visible and infrared light. Every image used the same 9.5-square-mile (24.6-square-kilometer) area, based on the lagoon’s August 2017 outline and trimmed to exclude the glacier. Cloudy pixels were excluded from the ice percentage.
Images with more than 30% ice cover were reported separately, since they could show a frozen surface or densely packed broken ice. Monthly figures are medians from the remaining images. The outlet analysis covered water within about 0.9 miles (1.5 kilometers) of the channel to the sea.
The historical comparison used a July 26, 1987 image from USGS Landsat Collection 2 and an August 20, 2025 Sentinel-2 image. The total lagoon area was measured separately on August 10, 2026, beyond the fixed area used for ice comparisons.
The winter analysis used 1,457 images from the Copernicus Sentinel-1 radar collection. Its ice-detection threshold was calibrated against 120 Sentinel-2 images taken within one day, rather than independently tested.
Radar supported the broad seasonal pattern, but individual winter comparisons often differed by 5 to 20 percentage points. With no usable optical images to check December or January, radar was used only to compare those months with summer, without precise percentages or a winter ranking.
Guide to Iceland booking records covered three boat tours, one kayaking tour, and 16 tours from Reykjavik visiting the lagoon between January 2023 and August 2026. Records also covered 15 ice cave tours starting at the lagoon between October 2024 and August 2026.
Cancellation rates are the share of all monthly bookings whose cancellation notes cited weather, wind, roads, or unsafe conditions. Cancellations without a recorded reason were not counted as weather-related, so the rates may be understated.
Diamond Beach photos came from Flickr and Wikimedia Commons, using camera capture dates and counting each photographer once per day. Flickr photos with matching capture and upload times were excluded.
Photos were grouped by how much beach ice they showed, with close-ups kept separate because they could not show the overall amount. Shared photos may favor beaches with ice, so they cannot establish how often visitors find an empty beach.
Traveler reports came from r/VisitingIceland and r/Iceland posts mentioning Diamond Beach between 2017 and 2026. Visit dates were estimated from the posting date and phrases such as “last week” for 35 of the 64 dated reports. Small samples limit seasonal comparisons.
Weather analysis used Icelandic Met Office records, including its monthly weather station tables. Temperature and gale figures came from the Kvisker weather station for 2015–2025. Precipitation figures came from the station tables for Kvisker and Hofn, and cloud figures from those for Fagurholsmyri. Daylight was calculated for the lagoon’s latitude, and northern lights activity used the GFZ Kp index.
Road traffic analysis used Vegagerdin’s daily vehicle counts at Kvisker. Unusually low traffic was treated as a possible sign of disruption, since the counter does not record road closures. Pandemic years were excluded from that comparison.
Published studies and official reports supplied the glacier, lagoon, and coastal history, with sources linked beside the relevant findings. The 2050 lagoon area is our own extrapolation from the 2026 measurement and historical growth rates, rather than a published forecast.
When Is the Best Time To Visit Jokulsarlon?
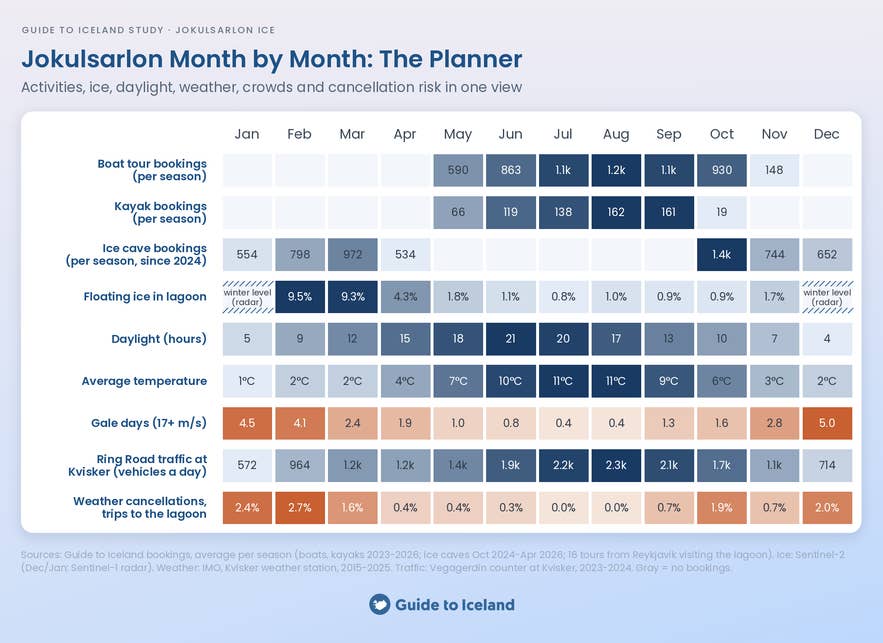
The best time to visit Jokulsarlon is from February to April if seeing plenty of ice is your priority. April is the sweet spot for balancing ice, daylight, and weather.
The lagoon holds more floating ice than in summer, while April has longer days and fewer gales than the winter months. Boat tours are more limited in April, so check departures if you want to get out on the water.
Each season has its trade-offs, so the planner below puts activities, ice, daylight, weather, crowds, and cancellation risk side by side. Ring Road traffic is used as an indicator of how busy the area may be.
Is Summer or Winter Better at Jokulsarlon?
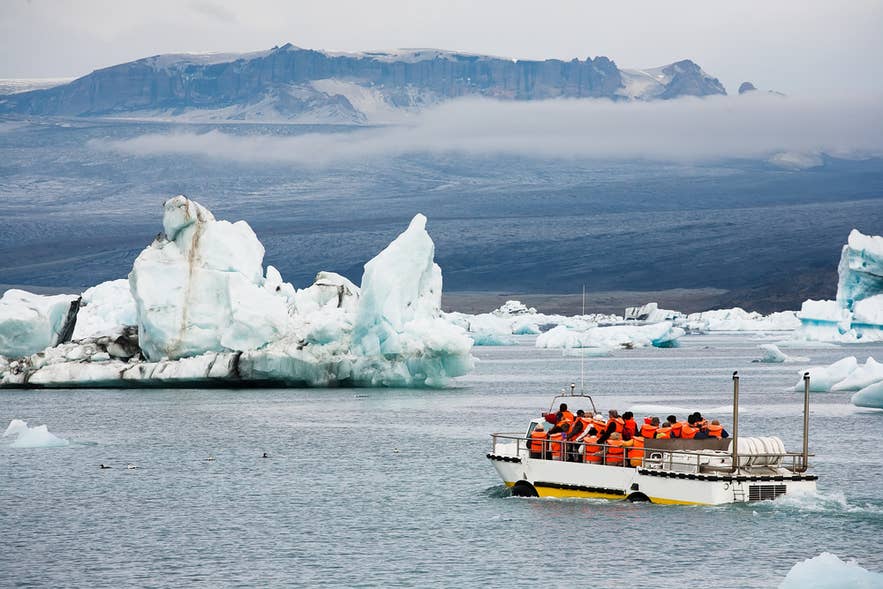
Summer (June to August) is when you have the widest choice of boat tours and kayaking tours on Jokulsarlon, subject to weather and ice conditions. The average July temperature at Kvisker reaches 52 F (11 C), and there are up to 21 hours of daylight in June. The catch is that summer has less floating ice than late winter and spring, and it is the busiest time on the road.
Winter (November to March) is ice cave season and northern lights season. The lagoon holds far more floating ice in winter, especially in February and March, though the amount varies from day to day.
Days are short, with about 4 hours of daylight in December and 5 in January. The Ring Road can be icy, so checking the current road conditions before driving in Iceland is a must. From December to February, gales are more than ten times as common as in July and August.
When Is the Weather Best at Jokulsarlon?
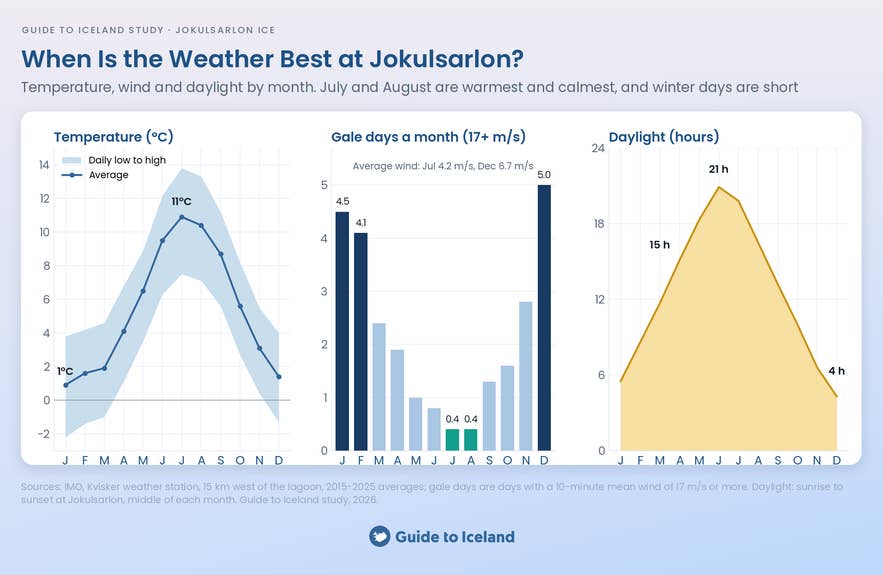
July and August have the warmest weather at Jokulsarlon and the fewest gale-force days. In the study’s 2015–2025 data from the Kvisker weather station, gale-force wind occurred on 0.4 days a month, compared with 4.1 to 5.0 days a month from December to February.
Kvisker receives a lot of rain and snow. The Met Office’s historical precipitation records for Kvisker put its annual average at around 146 inches (3,700 millimeters) from 1991 to 2012, more than twice the figure in the records for Hofn. May to July is the driest stretch at Kvisker, while September and October are the wettest months.
When Do Roads Close and Tours Get Canceled at Jokulsarlon?

To look for possible travel disruptions near Jokulsarlon, the study examined Vegagerdin’s daily traffic counts at Kvisker, on Route 1. The counter does not record road closures, so a sharp drop in traffic is only a possible sign of disruption.
In 2019 and 2022 to 2024, nearly all days with unusually low traffic fell between December and March. The analysis excluded 2020 and 2021 because the pandemic disrupted normal travel.
Traffic can also drop during storms or public holidays even if the road stays open. The counts cannot show which of these days involved a closure.
Booking records for 16 tours from Reykjavik that visit the lagoon show a similar seasonal pattern. The figures compare the share of bookings canceled for recorded weather or road reasons, since the number of bookings varies by month.
The rate was 2.7% in February and 2.4% in January, compared with 0.4% in both April and May. No such cancellations were recorded in July or August. These rates may be understated because cancellations without a recorded reason were not counted as weather-related.
When Is Jokulsarlon Most Crowded?
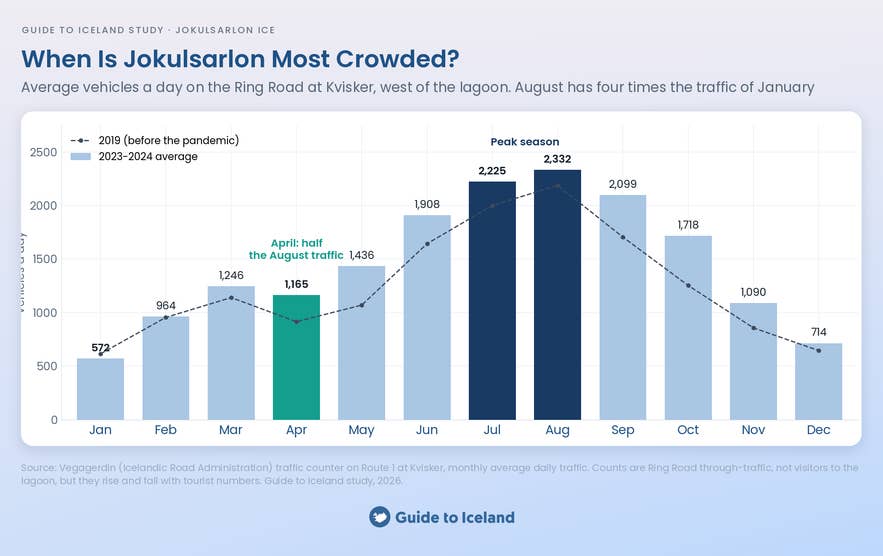
August is likely the busiest month at Jokulsarlon, with July close behind. Vegagerdin’s daily traffic counts at Kvisker averaged about 2,330 vehicles a day in August and 2,225 in July in 2023 and 2024.
Those vehicles passed a counter on the Ring Road, so the figures are a guide to traffic near Jokulsarlon, not a count of lagoon visitors. Separately, Vatnajokull National Park’s 2023 annual report estimates that around 968,000 people visited the Jokulsarlon area that year.
April offers a compromise for visitors who want more floating ice and less traffic than in summer. The study’s earlier satellite analysis found 4.3% floating ice cover in April, compared with about 1% from June to August. Traffic at Kvisker averaged 1,165 vehicles a day in April, roughly half the August figure.
Which Month Has the Most Ice at Jokulsarlon?
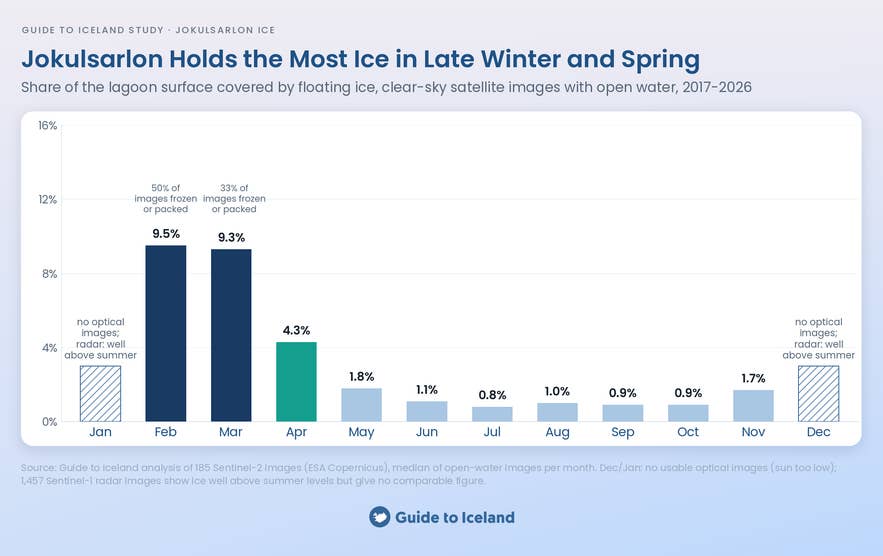
February and March have the highest measured floating-ice coverage at Jokulsarlon in images with open water. In clear Sentinel-2 satellite images, the monthly median was 9.5% of the measured lagoon in February and 9.3% in March. That is about 0.9 square miles (2.3 square kilometers) of ice.
July was lowest at 0.8%, or about 0.08 square miles (0.2 square kilometers). Ice cover fell to 4.3% in April and 1.8% in May, then stayed near 1% from June through October. It rose to 1.7% in November.
These percentages exclude images in which the lagoon was frozen or packed with ice. The graphic reports those separately for 50% of February images and 33% of March images.
There were no usable optical images for December or January because the sun was too low. The study used 1,457 Sentinel-1 radar images to examine the dark months. Radar shows much more ice in December and January than in summer, but its readings are not precise enough to rank those months against February and March.
April has less floating ice in the open-water images than February or March, but substantially more than summer. It may offer a better balance for visitors who want to see icebergs with open water around them, since many of the February and March images were frozen or packed with ice.
What Does Jokulsarlon Look Like in Each Season?
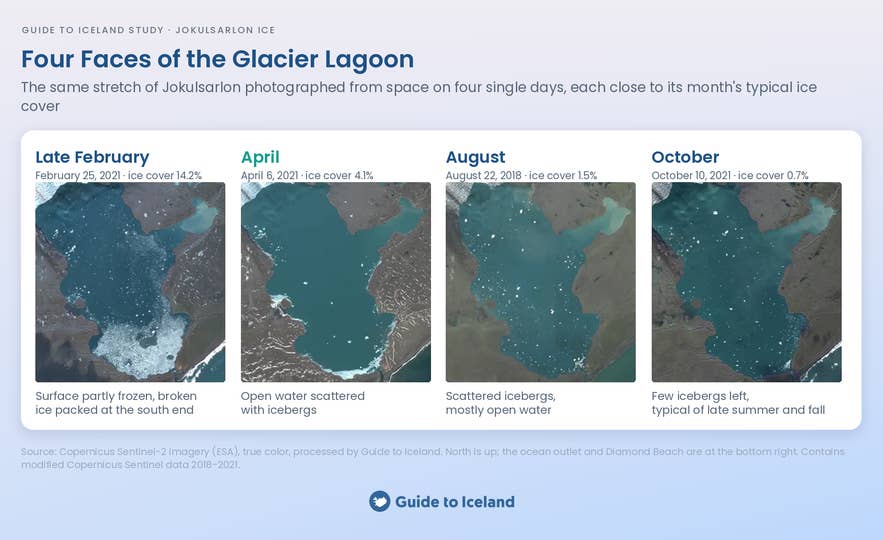
These Sentinel-2 satellite images show the same stretch of Jokulsarlon on four individual days of each season. They illustrate how the lagoon can change through the year, though each day may differ from its month’s usual ice cover.
In the late-February image, part of the surface is frozen and broken ice is packed at the south end. The April image shows open water with scattered icebergs. Many smaller bright pieces are visible in the August and October images, even though ice covers much less of the lagoon than in April.
Surface ice can hold some icebergs in place. As it breaks up, those icebergs can move again, though the images do not show when or how many reach the outlet and Diamond Beach.
Why Is There More Ice in Jokulsarlon in Spring Than in Summer?
The satellite analysis of Jokulsarlon shows the seasonal pattern, including in spring and summer, but does not measure what causes it. Research on floating ice at Jokulsarlon also describes a winter maximum and summer minimum. Breidamerkurjokull supplies the lagoon with icebergs when ice breaks from its front.
Colder conditions may let ice remain in the lagoon longer during winter. As the lagoon thaws, ice held by a frozen surface can move again.
Research on how calved ice melts in Jokulsarlon identifies seawater and atmospheric heat as important sources of energy for melting. Melting and movement through the outlet may help explain the lower ice cover in summer.
Does the Amount of Ice in Jokulsarlon Change From Year to Year?
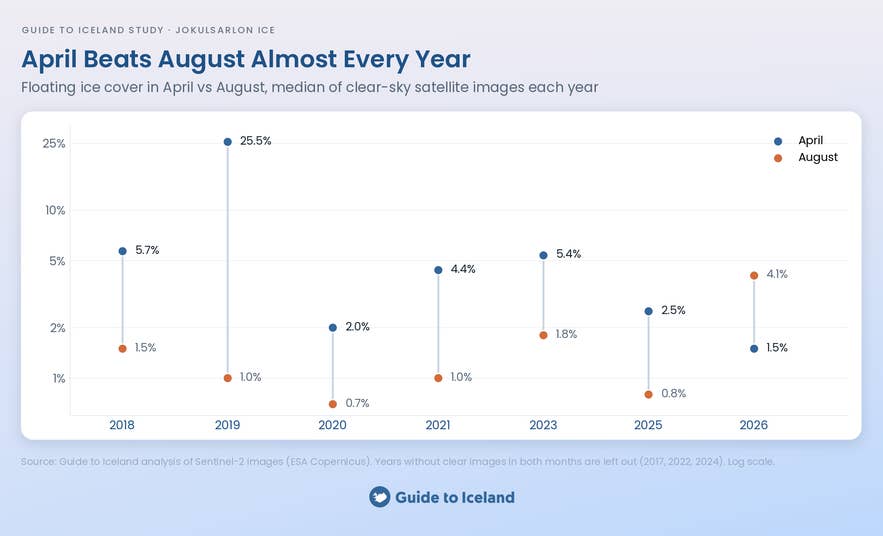
Yes, the amount of ice in Jokulsarlon changes annually. April’s median floating-ice cover ranged from 25.5% in 2019 to 1.5% in 2026 in the years shown. The comparison uses clear Sentinel-2 satellite images from each month, so these figures describe monthly medians rather than single days.
April still had more floating ice than August in six of the seven years with usable images for both months. The exception was 2026, when April’s median was 1.5% and August’s was 4.1%.
Across all usable open-water images, March had a higher monthly median than April. It may be the icier choice for visitors prepared for winter conditions, though a third of March images were frozen or packed with ice.
The satellite analysis shows the year-to-year changes but does not establish what caused them.
Where Do the Icebergs Come From, and How Do They Reach Diamond Beach?
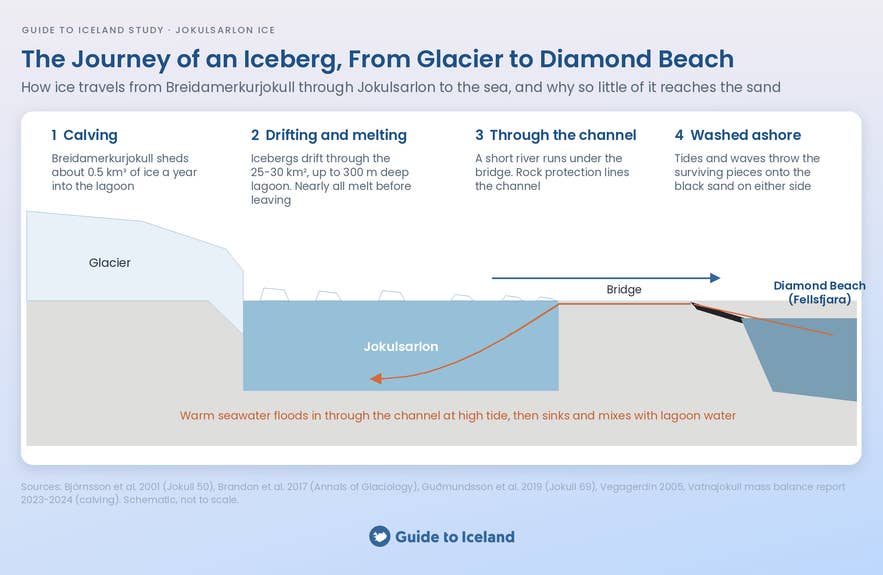
Icebergs at Jokulsarlon come from Breidamerkurjokull, an outlet glacier of Vatnajokull Glacier. Ice breaks off, or calves, from its front into the lagoon.
The 2023–2024 Vatnajokull mass balance report estimates that the glacier loses around 0.12 cubic miles (0.5 cubic kilometers) of ice to calving each year. A 2001 study of the glacier and lagoon put the rate at about 0.07 cubic miles (0.3 cubic kilometers) a year in the late 1990s.
The icebergs drift through the tidal lagoon, melting as they go. A study of seawater flowing into Jokulsarlon estimated that a typical incoming tide brings in about 117 million cubic feet (3.3 million cubic meters) of seawater. Denser than the lagoon water, it sinks and mixes as it enters.
The same study recorded the water in the outlet channel warming from about 36.3 F to 48.9 F (2.4 C to 9.4 C) within 20 to 30 minutes during an incoming tide in August 2011. The 2001 study’s estimate of the lagoon’s heat budget attributed half to two thirds of the heat melting its ice in the late 1990s to incoming seawater.
That earlier heat estimate suggested the lagoon could melt nearly all the ice calving into it, leaving relatively little to reach the sea. Surviving pieces travel through the short outlet river beneath the Ring Road bridge. Vegagerdin, the Icelandic Road Administration, maintains rock protection in the channel, which carries ice from the lagoon toward the sea.
Tides and waves can wash the pieces that reach the sea onto the black sand on either side of the river mouth. The ice from the lagoon then reaches Fellsfjara, widely known as Diamond Beach.
When Is There the Most Ice on Diamond Beach?
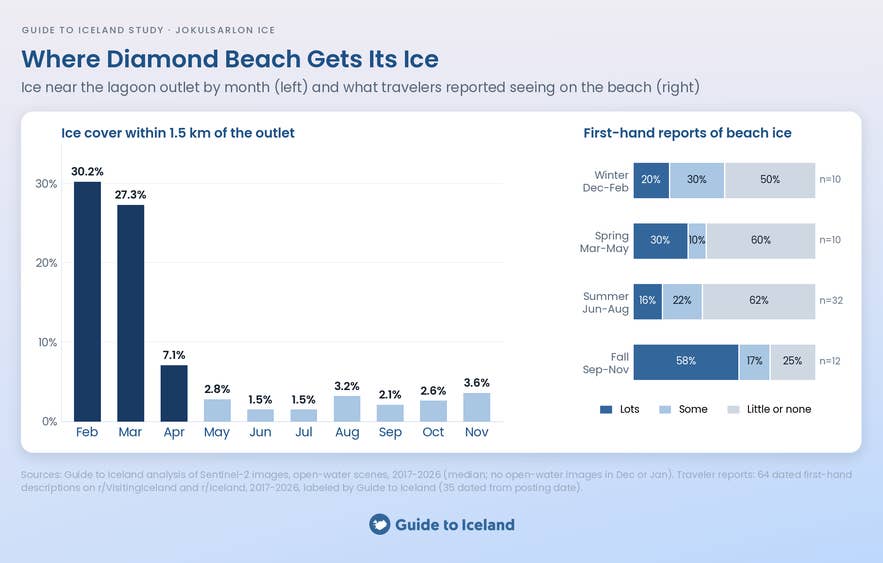
No single month is clearly best for ice on Diamond Beach. The lagoon outlet held the most ice in February and March, but traveler reports did not show the same late-winter peak on the beach. Fall had the highest share of reports describing lots of beach ice, though the sample is too small to rank the seasons.
The outlet is where ice can leave the lagoon for the sea. In clear satellite images taken when the water was open, ice covered about 30% of the area near it in February, 27% in March and 7% in April. Cover fell to between 1.5% and 3.6% from May to November. There were no usable open-water images for December or January.
These figures describe ice near the lagoon’s exit. To see what reached the sand, the study examined dated Diamond Beach photos on Flickr and Wikimedia Commons. About 600 photographer visits were recorded, including 309 with a wide enough view to judge the amount of ice.
Almost all those photos showed at least some ice. People may be more likely to photograph and post a beach with ice on it, so the photos cannot establish which season is best.
The study also reviewed 702 posts and comments mentioning Diamond Beach in Reddit’s r/VisitingIceland and r/Iceland communities. It identified 130 first-hand descriptions of beach ice, 64 of which could be dated. In summer, 62% of the 32 dated reports described little or no ice, the highest share of any season.
Fall had the highest share describing lots of ice on the beach, at 7 of 12 reports. The February and March accounts were mixed, with 7 of 9 describing little or no ice. Those reports came from only a few periods.
Why Are Icebergs Blue, White, Black, or Transparent?
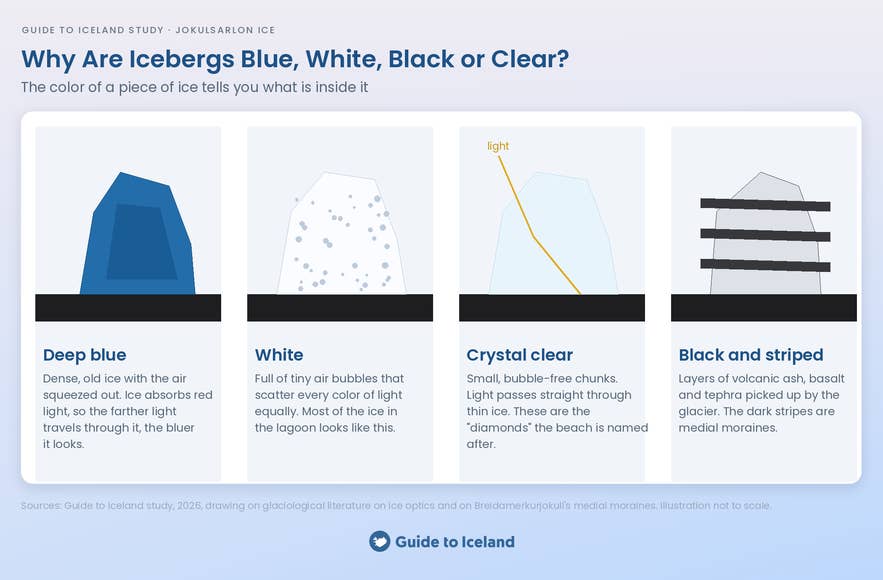
An iceberg’s color can offer clues about the ice inside it. Older, compressed glacier ice can look deep blue when much of the air has been squeezed out. The USGS explanation of why glacier ice looks blue describes how ice absorbs red light, so the longer light travels through it, the bluer it looks.
Much of the ice in Jokulsarlon looks white. It contains tiny air bubbles that scatter light back out before it travels far enough through the ice to look blue. The National Snow and Ice Data Center’s explanation of glacier ice colors describes this difference.
Small pieces with few bubbles can look crystal clear. Light passes through thin ice more easily, giving some of the pieces on Diamond Beach the appearance of diamonds.
Black or striped ice contains dark material carried by the glacier, including volcanic ash and rock debris. Breidamerkurjokull also has long debris stripes on its surface called medial moraines. A 2024 study of those moraines describes basalt, tuff, and tephra, as well as bands of debris within the ice.
Why Is the Sand on Diamond Beach Black?
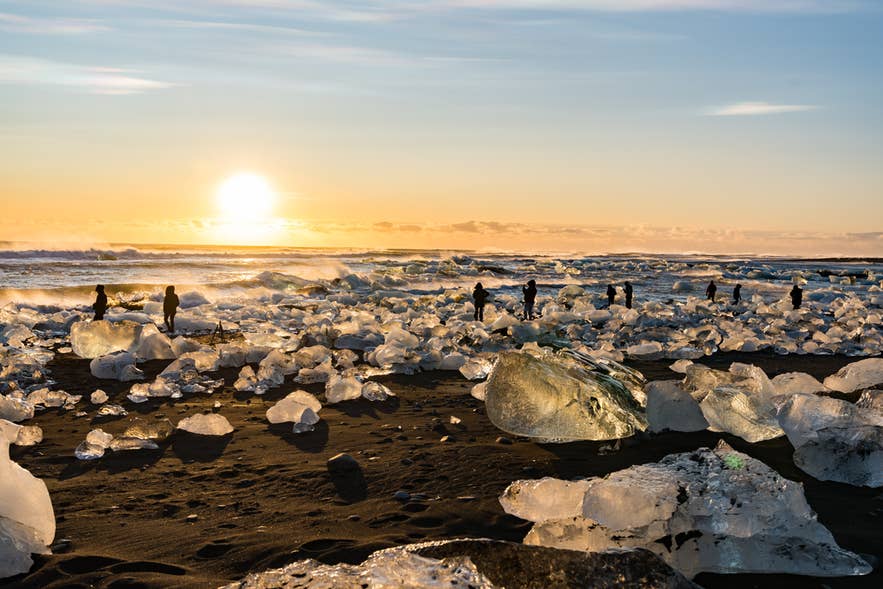
The sand on Diamond Beach is black because it contains dark volcanic material. A Vegagerdin study of sand from Breidamerkursandur found volcanic glass and rock fragments in a sample from the beach east of the river mouth.
Diamond Beach lies along Breidamerkursandur, an outwash plain built by rivers carrying sediment from Breidamerkurjokull and neighboring glaciers. A study mapping the plain measured its area at about 69 square miles (178 square kilometers) in 2018. Its near-black sand makes the ice washed ashore stand out.
When Can You Take a Boat Tour on Jokulsarlon?
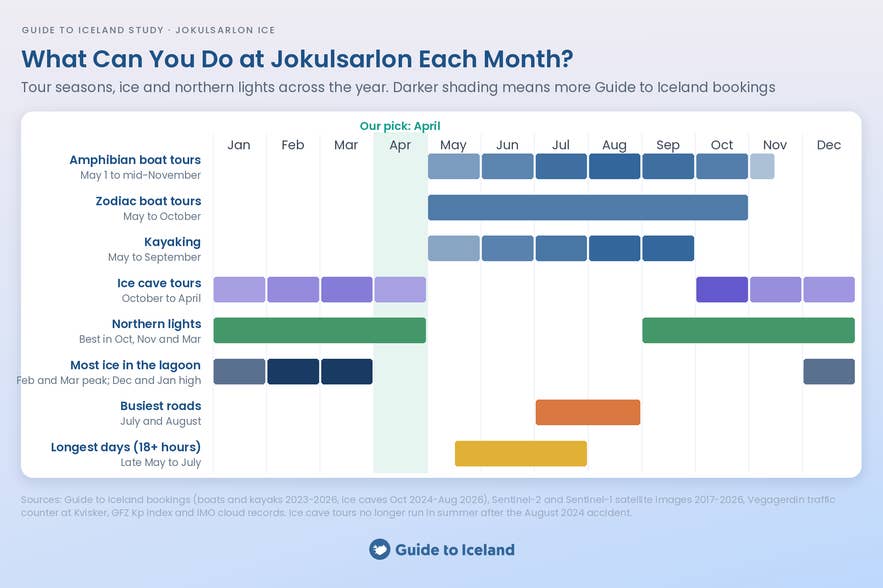
The amphibian boat tour on Jokulsarlon runs from May to November. The Jokulsarlon zodiac boat tour runs from May to October, while the kayaking tour on Jokulsarlon runs from May to September. Check the tour calendar for departures on your travel dates.
If seeing icebergs from a boat is your priority, May has the most ice of the boat season in our satellite images. Ice covered a median 1.8% of the measured lagoon area in May, more than twice July’s 0.8%. Guide to Iceland recorded about half as many boat bookings in May as in an average August.
August had the most boat bookings and the lowest recorded weather cancellation rate, at 1.9%. The rate rose to 9.3% in September and 10.2% in October.
From May through September, between 10% and 20% of kayak bookings were canceled each month with weather or road conditions listed as the reason. Some cancellations had no reason listed, so the weather-related rates may be higher.
When Is Ice Cave Season at Jokulsarlon?
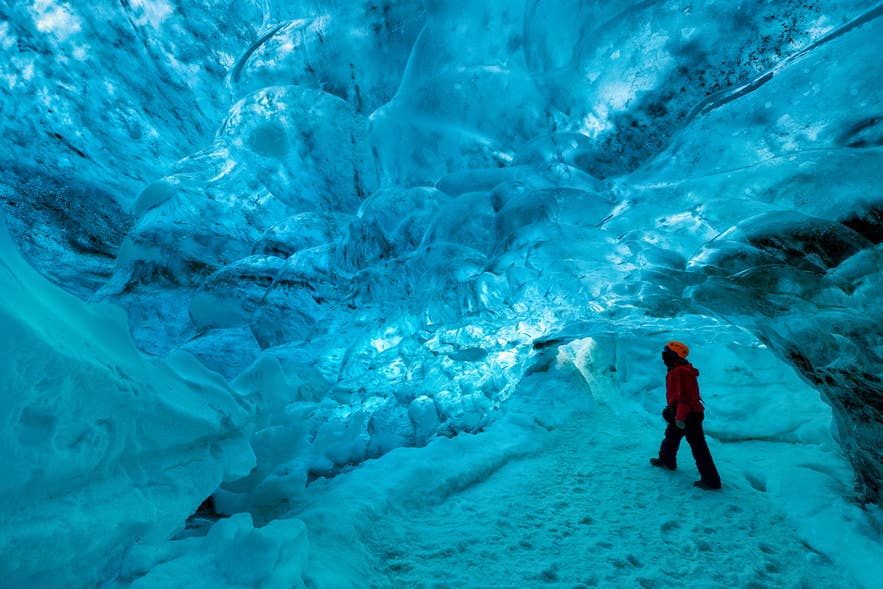
Ice cave tours in Iceland that depart from Jokulsarlon run from October to April. The Crystal Blue Ice Cave tour visits Breidamerkurjokull, the glacier that feeds the lagoon. Tours in our sample have stayed within that winter season since an ice wall collapsed there in August 2024.
Across the two seasons from October 2024 to April 2026, October had the most Guide to Iceland ice cave bookings from Jokulsarlon, averaging about 1,380 per season. March and February followed. Recorded weather or road cancellation rates were highest in February and October, at 3.4% and 3.3%, compared with 0.5% to 2.6% in the other tour months.
The study of ice cave safety by month explains the conditions at the start of the season. The study of the best time to visit ice caves covers crowds and daylight. For a trip that combines an ice cave with lagoon icebergs, March or April offers more daylight, though the lagoon can still be partly frozen in March.
You can combine the lagoon and a cave on a two-day Jokulsarlon and Crystal Blue Ice Cave tour or a three-day tour with ice caving. Outside the Jokulsarlon ice cave season, the year-round Katla Ice Cave tour from Vik visits Myrdalsjokull, which is closer to Reykjavik.
Can You See the Northern Lights at Jokulsarlon?
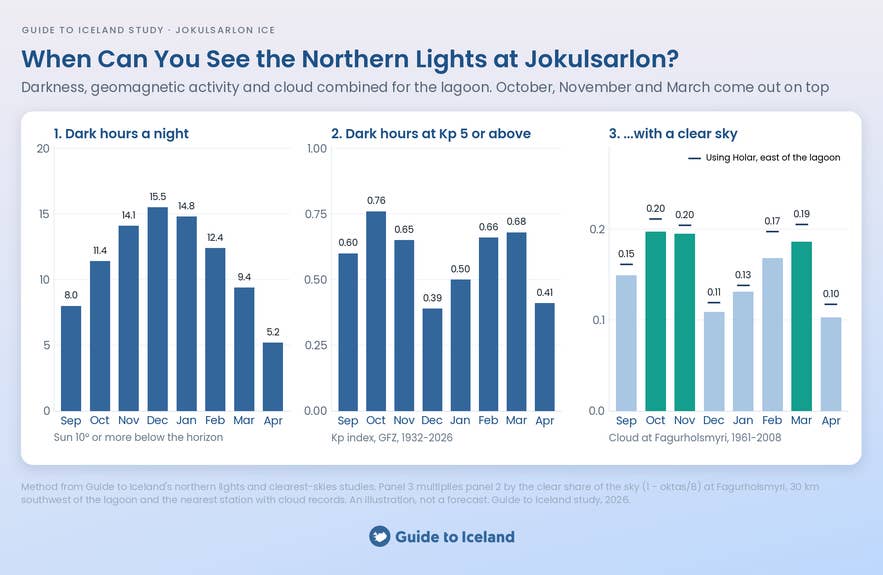
Yes, you can see the northern lights at Jokulsarlon during the dark months, generally September through April. October, November, and March lead our comparison, which combines hours of darkness, cloud cover, and disturbances in Earth’s magnetic field that help produce the northern lights.
The calculation adapts our study of the best month to see the northern lights. It uses the same GFZ geomagnetic activity records, with darkness calculated for the lagoon. Night lengths are similar to Reykjavik’s because the two places sit at almost the same latitude.
Cloud estimates use Met Office historical station records from Fagurholsmyri, about 19 miles (30 kilometers) southwest of the lagoon, covering 1961–2008. Nearby cloud observations help compare the months, but conditions at the lagoon can differ.
After allowing for cloud cover, October, November, and March score highest, with February close behind. The graphic compares long-term conditions rather than counting sightings or predicting a particular night. The comparison uses Kp 5 or above as the threshold, but northern lights can be visible at lower activity levels.
Our study of Iceland’s clearest skies compares the lagoon’s region with the rest of the country. For your visit, check the northern lights forecast, since cloud cover can change quickly.
February and March combine northern lights viewing with the highest median lagoon ice cover measured in clear satellite images with open water. Much of the late-winter ice can still be packed together or frozen in place.
A three-day Jokulsarlon tour with northern lights hunting combines the lagoon visit with evening viewing opportunities when conditions allow.
How Fast Is Jokulsarlon Growing?
Jokulsarlon grew by an average of about 0.21 square miles (0.55 square kilometers) a year between 1982 and 2018. A study of lagoon growth and glacier retreat measured that increase. Growth varies over time, so the figure describes that period rather than the lagoon’s current annual growth.
The lagoon began forming in 1933 as Breidamerkurjokull retreated. A 2019 study of lakes along southern Vatnajokull records two lakes at its present location in 1945, measuring about 0.2 and 0.6 square miles (0.5 and 1.6 square kilometers). They merged in 1954.
The same study found that growth accelerated over the historical record. Average annual growth rose from about 0.08 square miles (0.2 square kilometers) during 1933–1991 to 0.23 square miles (0.6 square kilometers) during 1991–2018. The lagoon more than doubled in area during the later period.
By 1982, the lagoon covered about 2.9 square miles (7.6 square kilometers). A separate satellite study of the lagoon’s expansion measured about 5.6 square miles (14.6 square kilometers) in 1999.
A 2025 study of glacier retreat and lake growth measured about 10.6 square miles (27.5 square kilometers) in 2020. Guide to Iceland’s own measurement using Sentinel-2 imagery from August 10, 2026, puts the area at about 11.6 square miles (30 square kilometers), including the northeastern arm.
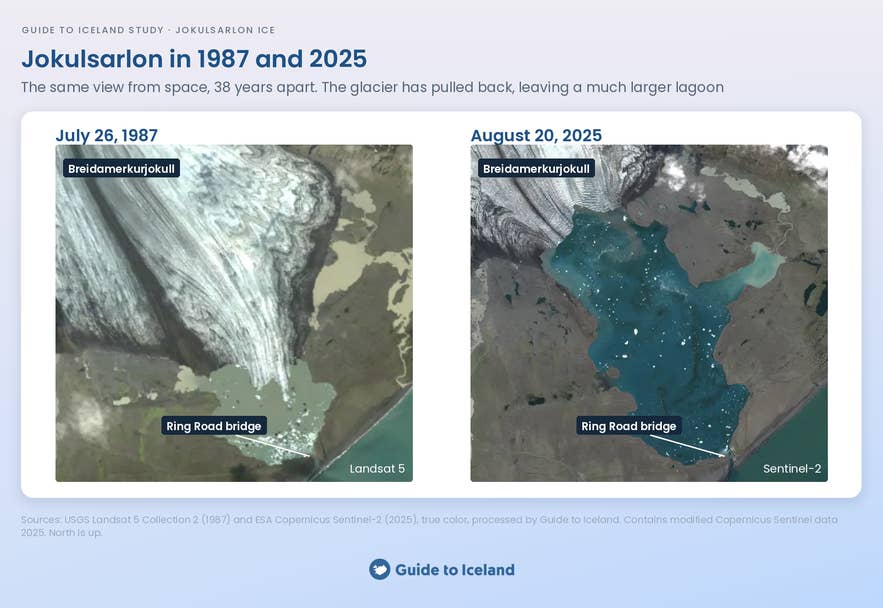
The satellite images below show the same area on July 26, 1987, and August 20, 2025, 38 years apart. The glacier has retreated inland, leaving a much larger lagoon in front of it.
A 2024 study documenting Breidamerkurjokull’s changes identifies increased calving during 2001–2010, when ice broke off into the lagoon. Between 2010 and 2021, the glacier front retreated about 0.6 to 0.8 miles (0.9 to 1.3 kilometers), with some sections retreating more than 660 feet (200 meters) in a year.
How Deep Is Jokulsarlon?
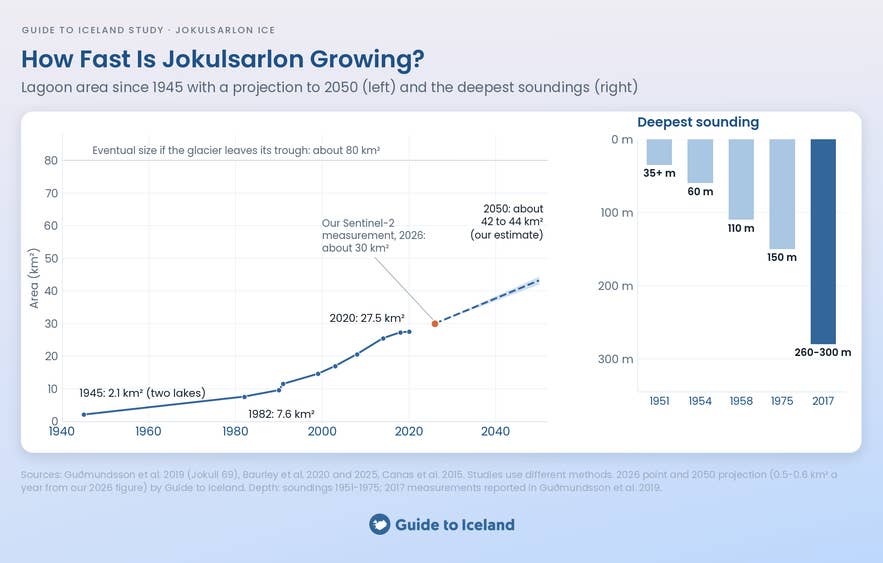
Jokulsarlon reaches about 980 feet (300 meters), making it Iceland’s deepest lake. A study of southern Vatnajokull’s glacier lakes reports depths of 850 to 980 feet (260 to 300 meters) measured in 2017.
The graphic shows progressively deeper measurements as the glacier retreated. Recorded depths were at least 115 feet (35 meters) in 1951, 197 feet (60 meters) in 1954, 361 feet (110 meters) in 1958, and 492 feet (150 meters) near the glacier front in 1975. These measurements were taken at different locations.
The glacier’s retreat exposed deeper parts of a valley it had carved below sea level. By the time of the 2019 study, its front stood at the deepest part of the mapped valley.
The same study estimated the lagoon’s water volume at about 0.65 cubic miles (2.7 cubic kilometers). That was more than five times the 1975 estimate of 0.12 cubic miles (0.5 cubic kilometers), rather than a measurement of its volume today.
Is Jokulsarlon a Visible Sign of Climate Change?
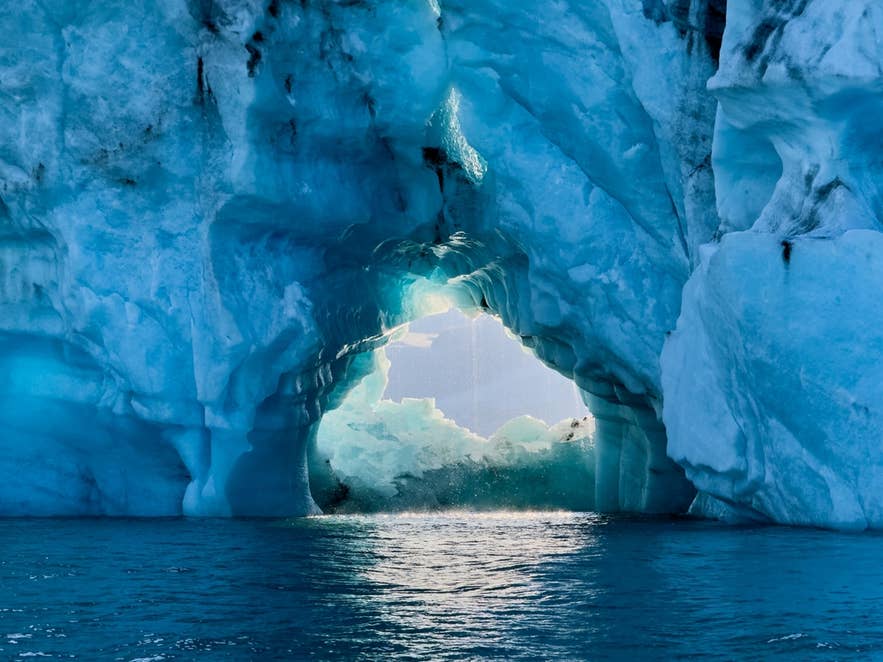
Yes, Jokulsarlon is a visible sign of climate change. The lagoon began forming in 1933 as Breidamerkurjokull retreated. Guide to Iceland’s August 2026 satellite measurement puts its area at about 11.6 square miles (30 square kilometers), showing how much water now occupies land formerly covered by the glacier.
Research on lagoon growth and glacier retreat links its expansion to rising air temperatures. The growing lagoon also affects the glacier, helping explain why the retreat has accelerated.
The retreat has varied over time. A study of Breidamerkurjokull’s changes describes cooler conditions during 1965–1995, with some sections retreating and others advancing slightly during 1980–1995. Ice loss accelerated after 1995 as the climate warmed.
As the glacier retreated into deeper water, iceberg calving and melting at its front helped drive further retreat. It therefore loses ice through both surface melting and processes where it meets the lagoon.
The national park emphasizes climate change education around Jokulsarlon. Visitors can see the retreating glacier, expanding lagoon, and newly exposed landscape close together.
How Much Ice Does Breidamerkurjokull Lose Each Year?
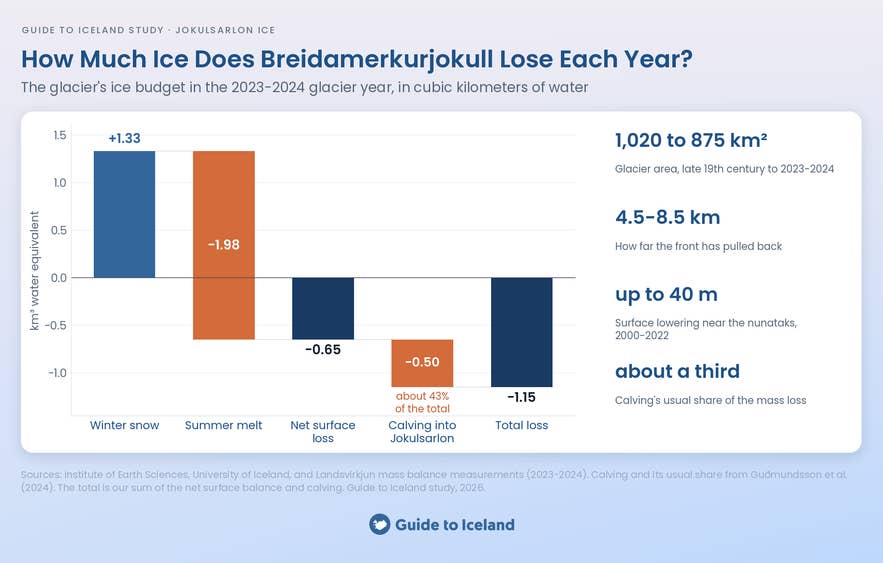
Breidamerkurjokull lost 0.16 cubic miles (0.65 cubic kilometers) of water equivalent at its surface in the 2023–2024 glacier year. Adding an approximate annual calving estimate gives Guide to Iceland’s combined estimate of roughly 0.28 cubic miles (1.15 cubic kilometers). The amount lost varies each year.
The 2023–2024 glacier mass balance report records winter snow gains of 0.32 cubic miles (1.33 cubic kilometers) and summer losses of 0.48 cubic miles (1.98 cubic kilometers). Water equivalent means the volume of water the snow and ice would produce when melted.
The resulting surface loss averaged about 2.4 feet (0.74 meters) of water across the glacier. The report separately estimates annual losses of around 0.12 cubic miles (0.5 cubic kilometers) through calving, when icebergs break off into Jokulsarlon.
A study of Breidamerkurjokull’s retreat and thinning describes calving as roughly a third of its mass loss. In the graphic’s calculation, calving accounts for about 43%, although its contribution was estimated rather than measured specifically for that year.
The glacier covered about 394 square miles (1,020 square kilometers) at its late-19th-century maximum. The 2023–2024 report gives an area of about 338 square miles (875 square kilometers), a reduction of roughly 56 square miles (145 square kilometers).
The retreat study reports that different sections of the glacier front have pulled back about 2.8 to 5.3 miles (4.5 to 8.5 kilometers) since its maximum extent. It also documents thinning around exposed rock peaks, known as nunataks.
For a picture across Iceland’s ice caps, see our study of glacier melting rates in Iceland. It compares long-term ice loss, retreat, and thinning across the country.
What Will Jokulsarlon Look Like in 2050, and Could It Become a Fjord?
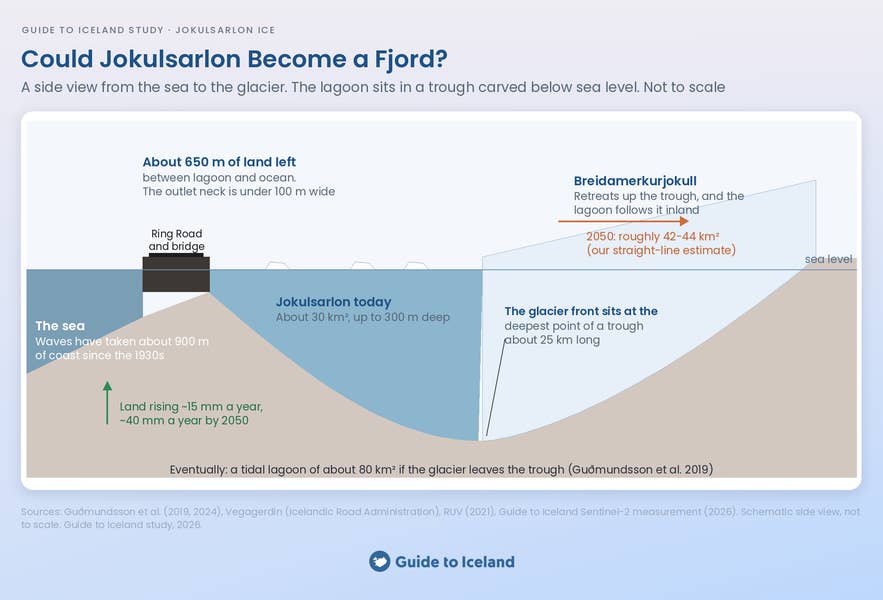
Jokulsarlon could cover about 16 to 17 square miles (42 to 44 square kilometers) by 2050 if historical growth rates continue. Growth alone would not turn it into an open fjord. The coastal barrier and the lagoon’s connection to the sea would also have to change.
Guide to Iceland’s estimate starts with its 2026 measurement of about 11.6 square miles (30 square kilometers). It adds 0.19 to 0.23 square miles (0.5 to 0.6 square kilometers) a year, consistent with research on lagoon growth since the 1980s. The result is a simple projection, not a published forecast.
A study of southern Vatnajokull’s glacier lakes places the glacier front at the deepest part of a valley about 15.5 miles (25 kilometers) long. The valley extends below sea level, allowing the lagoon to expand inland as the glacier retreats.
The same study describes a possible eventual tidal lagoon of about 31 square miles (80 square kilometers) if Breidamerkurjokull retreats out of the valley. It gives no date for that outcome.
An earlier model of Jokulsarlon’s future expansion, published in 2001, suggested that retreat out of the basin could take around 200 years under its assumptions. That was a glacier-retreat scenario, not a forecast of the sea breaking through the coast.
The coast has also changed because the lagoon traps sediment that once replenished the shore. A 2005 study of coastal erosion and protection recorded about 2,510 feet (765 meters) of shoreline retreat during 1904–2003 along one surveyed line east of the outlet.
Rock barriers and large protective stones help defend the riverbanks and road. The Road Administration’s coastal protection plans near Jokulsarlon describe continuing erosion and the need to protect the Ring Road.
Land uplift could help slow that erosion as the shrinking ice cap puts less weight on the ground. The 2005 study reported uplift of about 0.6 inches (15 millimeters) a year near Vatnajokull and suggested it could reach 1.6 inches (40 millimeters) a year by 2050.
Under the study’s assumptions, that uplift could reduce coastal erosion by as much as 10 feet (3 meters) a year by 2050. The research supports the possibility of a much larger lagoon, but does not establish when or if it will become an open fjord.
How To Visit Jokulsarlon and Diamond Beach
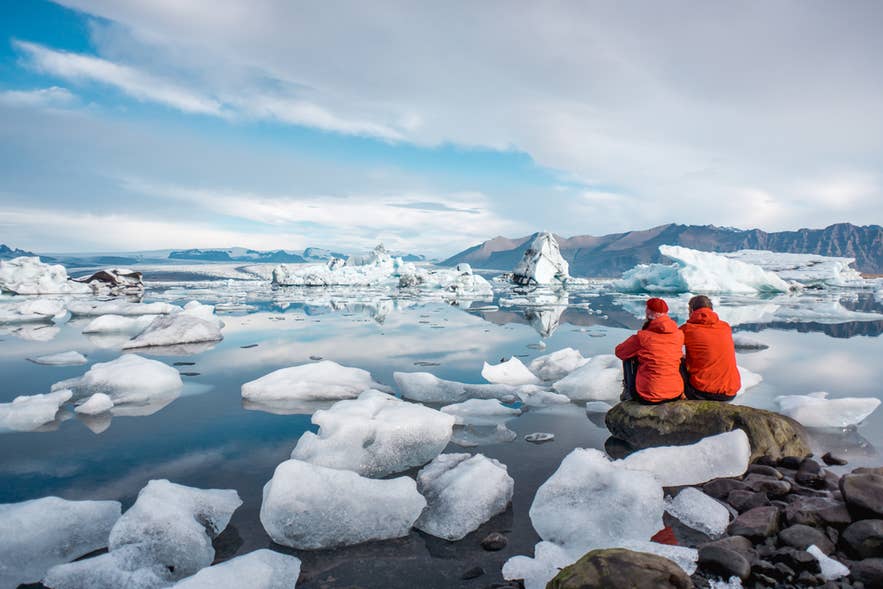
Jokulsarlon and Diamond Beach can be visited independently by rental car or on guided tours. Both are beside the Ring Road, with the lagoon inland and the beach on the seaside. You can view them from shore without joining a boat tour.
The main choice is how much travel to fit into one day. Jokulsarlon glacier lagoon tours include shared and private day trips from Reykjavik, multi-day excursions, and activities that begin at the lagoon. Check that the itinerary includes Diamond Beach.
A day trip suits travelers who need to return to Reykjavik that evening, but it involves a long journey. For example, a South Coast day tour with a Jokulsarlon boat ride lasts around 14 to 14.5 hours. Check how much time is allocated to each stop.
An overnight tour spreads the journey across two days. Options include a summer South Coast tour with glacier hiking and a lagoon boat ride and a winter South Coast tour with Jokulsarlon and ice caving. Both include Diamond Beach.
Driving independently from Reykjavik to Diamond Beach gives you control over arrival times and the length of each stop. You can arrange your own route and accommodation or use one of the self-drive tour packages in Iceland with Jokulsarlon in the itinerary.
Explore More Iceland Data Studies
The Guide to Iceland study series explores the weather, northern lights, glaciers, and tour experiences in Iceland that can shape a visit to the country. The guides add practical advice on planning your trip.
-
Glacier Melting Rates in Iceland: An Analysis of 135 Years of Data
-
Iceland’s Clearest Skies: The Best Regions for the Northern Lights
For practical information about the area, read the guides to Jokulsarlon Glacier Lagoon and Diamond Beach. The guide to Iceland in April covers spring weather, daylight, and activities.
To compare ways of visiting, browse Jokulsarlon tours, including local activities and guided trips. For an independent journey along the South Coast, compare rental cars in Iceland.
Guide to Iceland works with local boat, glacier, and ice cave operators who hold the permits for Jokulsarlon and Vatnajokull National Park. We support these partners throughout the year and work with them to make sure every tour meets the highest safety standards.

Guide to Iceland Editorials is the shared byline for our content team. We use it on pieces several people worked on together, where no single writer owns the article, and on anything rewritten often enough that a personal byline would be misleading. We also publish our original data studies under this profile. Each study answers a question travelers ask about Iceland, using primary sources such as booking records, traveler reviews and public datasets, and every study is quality checked by human experts before it's published. Everything under this byline is researched and reviewed by people who live and work in Iceland. If you spot something out of date or want to suggest a correction, message us and it reaches the whole team.